In diesem Artikel werden die Funktionen der neuen Analysen-Erfahrung beschrieben, die wir kontinuierlich verbessern. Wenn Sie Feedback zum neuen Analysen-Erlebnis haben, würden wir uns freuen, es von Ihnen zu hören.
Wenn Sie Analysen für die Funktion Schulungen anzeigen möchten, können Sie mehr über das Leistungs-Dashboard erfahren.
Was sind Analysen in SafetyCulture?
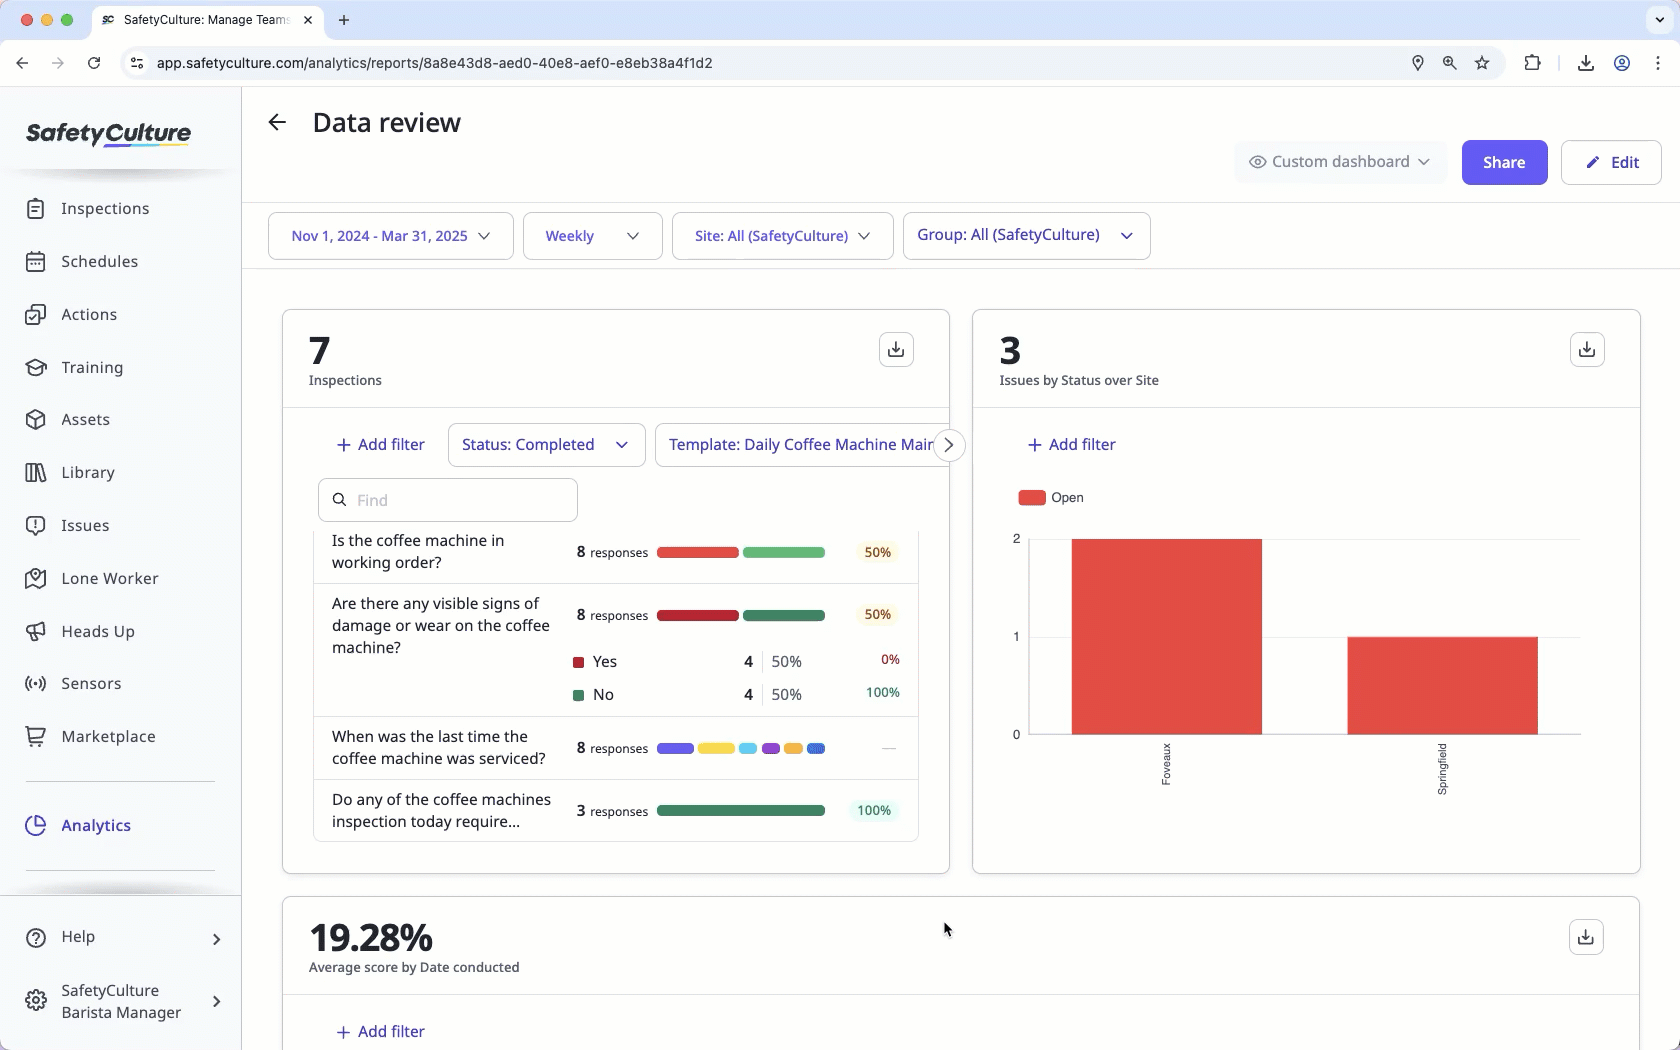
Analysen in SafetyCulture ermöglicht es Ihnen, die von Ihrem Team erfassten Daten zu visualisieren und zu verstehen. Dies ist besonders relevant, wenn Sie klare Einblicke in KPIs, Leistungstrends oder bestimmte Bereiche benötigen, die Aufmerksamkeit erfordern. Analysen arbeiten über anpassbare Dashboards, bei denen Sie aus verschiedenen Diagrammtypen wählen, die Darstellung Ihrer Daten individuell gestalten und den Zugriff über dedizierte Berechtigungen steuern können.
So können Sie beispielsweise die Inspektionsergebnisse standortübergreifend verfolgen, die Abschlussrate von Aktionen überwachen oder über einen bestimmten Zeitraum erstellte Daten überprüfen. Sie können auch Dashboards innerhalb Ihres Teams teilen oder Daten für die Berichterstattung exportieren, um Teams dabei zu helfen, Erkenntnisse zu gewinnen, Verbesserungsmöglichkeiten aufzuzeigen und datengestützte Entscheidungen zu treffen.
Analysen in SafetyCulture erkunden
Dashboards erstellen und teilen
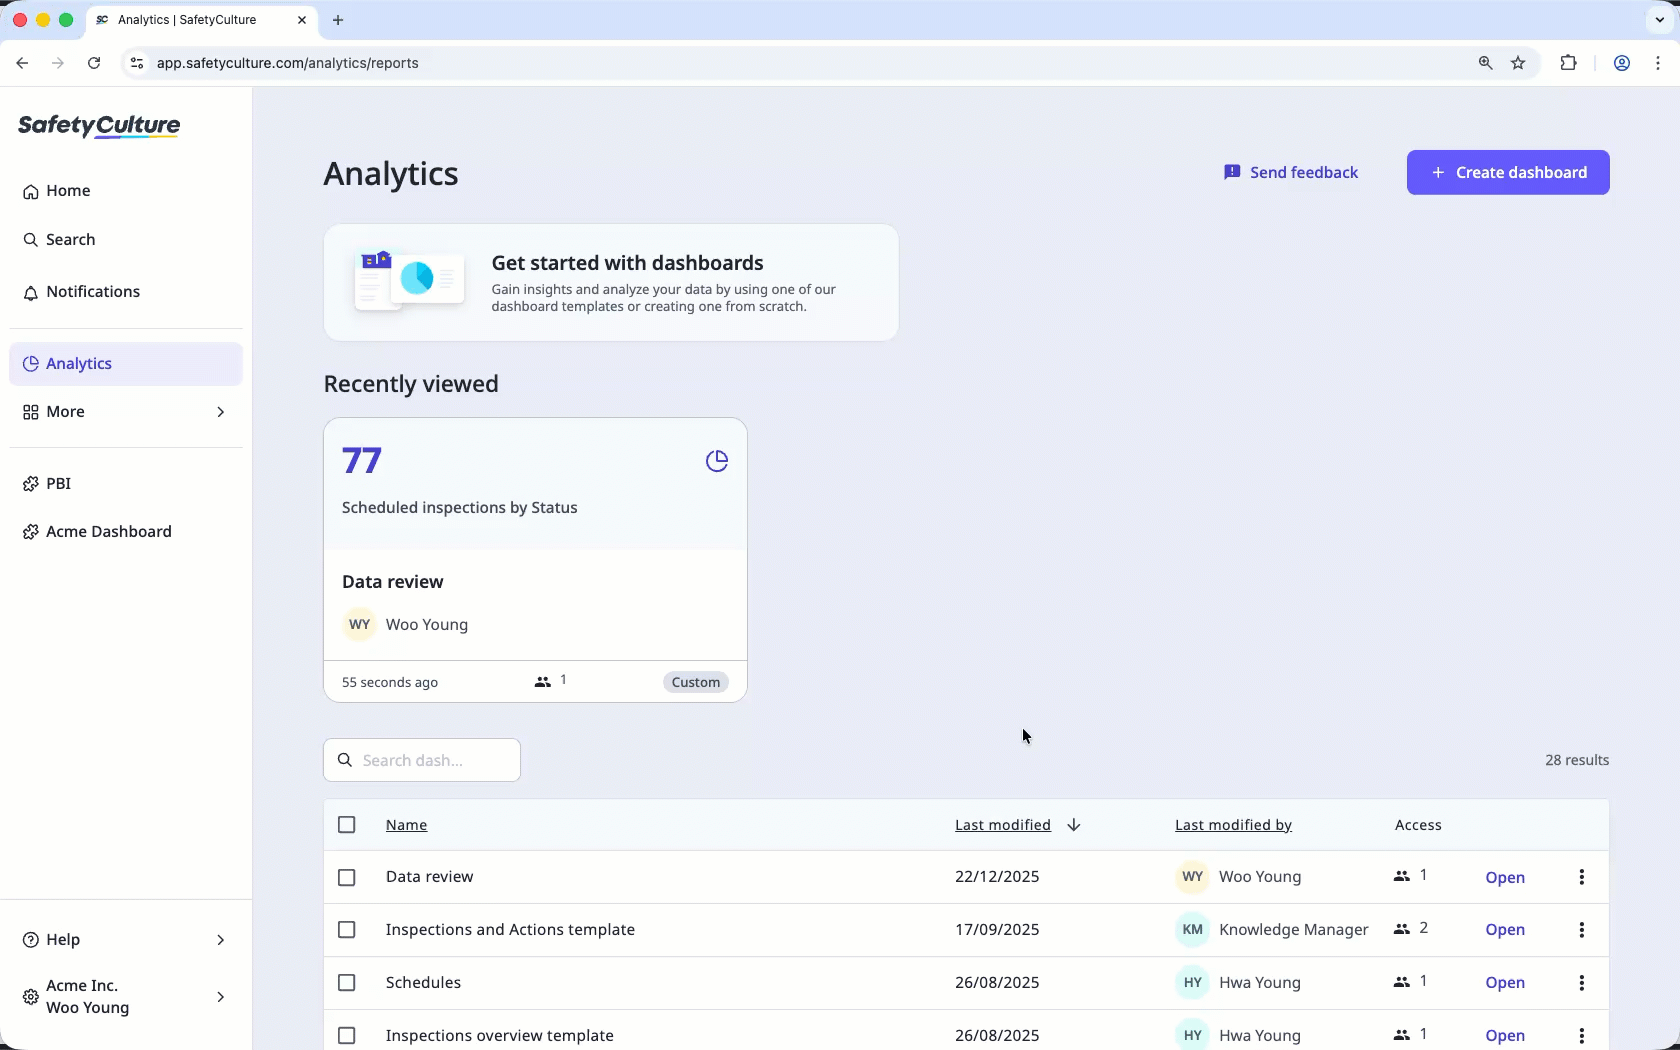
Analytics verfügt über eine Homepage, auf der Sie alle dashboards, auf die Sie Zugriff haben, anzeigen und neue Dashboards nach Ihren Bedürfnissen erstellen können. Auf diese Weise können Sie verschiedene Dashboardtypen einrichten, ohne jedes Mal, wenn Sie Analytics besuchen oder verschiedene Datensätze interpretieren möchten, Diagramme und Filter neu konfigurieren zu müssen. Sie können auch doppelte Dashboards erstellen, um dieselben Erkenntnisse mit verschiedenen Teammitgliedern zu teilen, ohne Ihre Einrichtung neu zu erstellen.
Um Ihnen den Einstieg in Ihr Dashboard zu erleichtern, können Sie aus unseren empfohlenen Vorlagen mit vorselektierten Datensätzen eine auswählen, die Ihren Anforderungen entspricht, oder ein neues Dashboard erstellen.
Präzise Datenfilterung
Konzentrieren Sie sich auf die wichtigsten Erkenntnisse, indem Sie leistungsstarke Dashboard- und Diagrammfilter verwenden, um Ihre Ansicht zu verfeinern. Mit Dashboard-Filtern können Sie Ihre gesamte Seite schnell nach Kriterien wie Datumsbereich, Häufigkeit, Standort oder Gruppe einschränken, um sicherzustellen, dass Ihre Daten immer für Ihre Berichtsanforderungen relevant sind. Für eine detailliertere Analyse können Sie auch Diagrammfilter anwenden, um bestimmte Datenpunkte aufzuschlüsseln und Ihre Auswahl genau abzustimmen. Indem Sie Ihren Fokus sowohl auf der Dashboard- als auch auf der Diagrammebene eingrenzen, können Sie das Rauschen durchdringen und genau die Informationen aufzeigen, die Sie benötigen, um Verbesserungen in Ihrem Unternehmen zu erzielen.
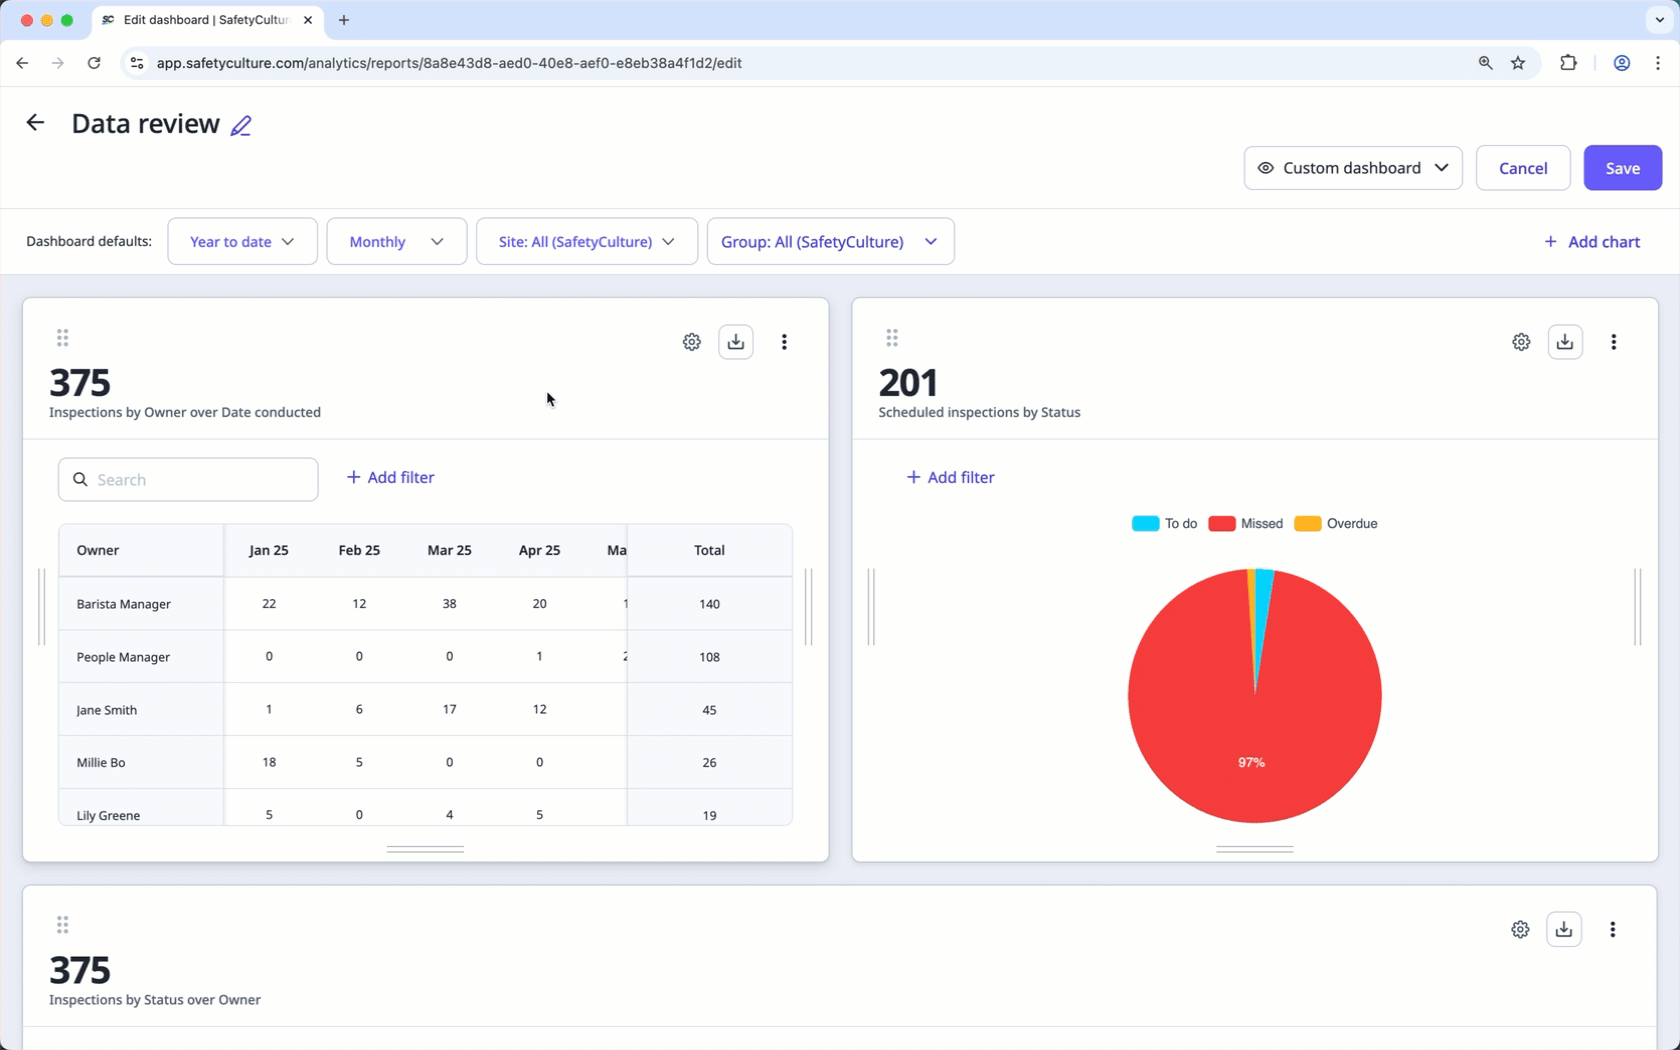
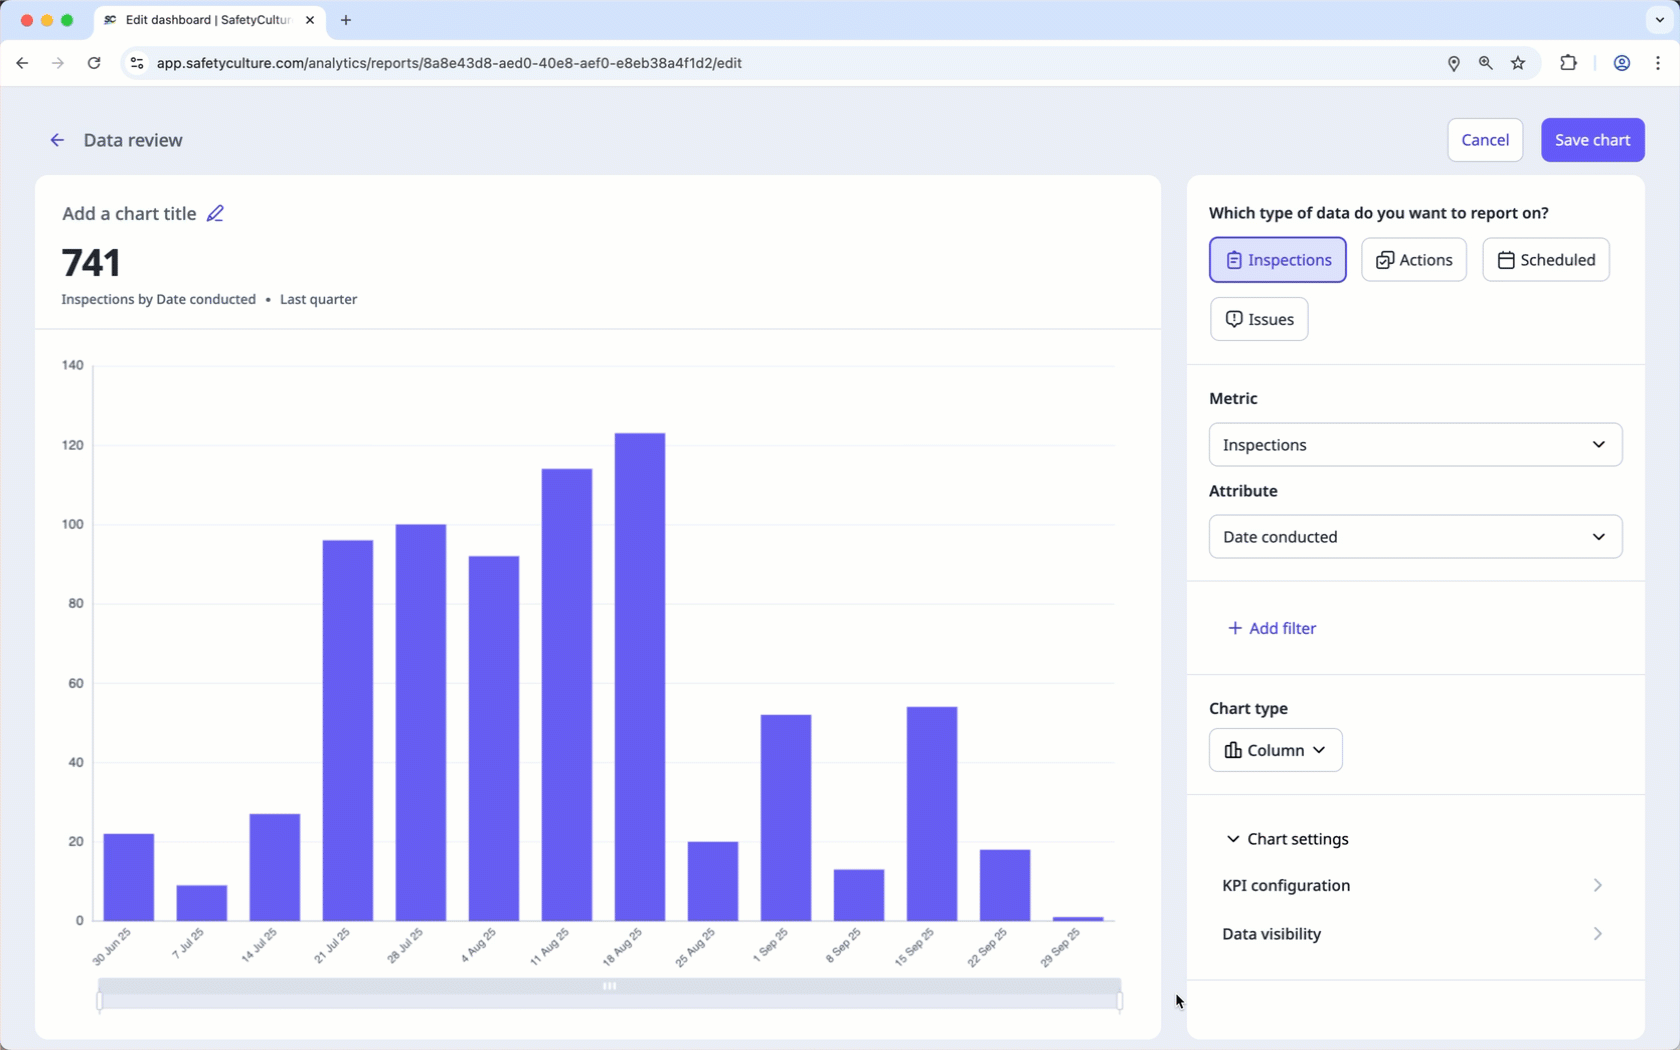
Anpassbare Diagramme
Visualisieren Sie Ihre Leistung genau so, wie Sie es wünschen, mit der flexiblen chart customization. Durch die Kombination spezifischer Metriken und Attribute können Sie Ihre Diagramme an Ihren Datentyp anpassen und rohe Erkenntnisse in sinnvolle Maßnahmen umwandeln. Wählen Sie den Diagrammtyp, der Ihre Geschichte am besten erzählt, und konfigurieren Sie KPIs, um den Fortschritt gegenüber Ihren Zielen in Echtzeit zu überwachen.
So können Sie beispielsweise die Anzahl der durchgeführten Inspektionen im Laufe der Zeit verfolgen, um sicherzustellen, dass Ihre Teams die gesetzten Ziele konsequent erreichen und auf Erfolgskurs bleiben.
Dashboards teilen
Sobald Sie Ihr Analytics-Dashboard für Ihren speziellen Anwendungsfall konfiguriert haben, können Sie es selektiv mit Gruppen oder Ihrer gesamten Organisation teilen. Durch die gemeinsame Nutzung Ihrer Dashboards erhalten Ihre Teams die Daten, die sie benötigen, um sich abzustimmen und fundierte Entscheidungen zu treffen, die die Sicherheit und Qualität der Leistung fördern. Ganz gleich, ob Sie eine Übersicht auf höchster Ebene für die Unternehmensleitung bereitstellen oder einen Link für bestimmte Teammitglieder generieren, die Zugriffsverwaltung stellt sicher, dass die richtigen Erkenntnisse die richtigen Personen zur richtigen Zeit erreichen.
Datenexport
Sie können Daten aus Analytics auf verschiedene Weise exportieren. Laden Sie Diagramme als Bilder oder CSV-Dateien herunter, oder exportieren Sie Datentypen wie Inspektionen, Aktionen, Probleme, Vorankündigungen und Zeitpläne in großen Mengen für eine detailliertere Analyse.
Sie können auch Ihr gesamtes Analytics-Dashboard als Schnappschuss aller Diagramme exportieren, damit Ihr Team Berichte austauschen oder Trends außerhalb der Plattform überprüfen kann.