Qu'est-ce que le tableau de bord des performances ?
Le tableau de bord des performances offre un affichage approfondi de la progression et de l'engagement de votre organisation pour la fonctionnalité Formation. D'une vue d'ensemble du taux d'achèvement des cours et des performances à une analyse détaillée des performances (score et achèvement) au niveau du cours, du groupe et de l'utilisateur, vous pouvez obtenir des informations sur la stratégie de formation qui fonctionne et affiner votre contenu au fil du temps afin d'améliorer continuellement l'apprentissage de votre équipe.
Le tableau de bord des performances vous offre un affichage approfondie des performances de formation dans votre organisation. Si vous souhaitez obtenir un affichage simple de la progression individuelle des cours des membres de votre équipe, envisagez d'utiliser la matrice de formation ou achèvement des cours par les utilisateurs.
Explorer le tableau de bord des performances dans SafetyCulture
Afficher vos données
Le tableau de bord des performances vous offre un affichage clair des activités de formation et des résultats de votre organisation. Il est organisé en différents onglets, chacun étant conçu pour vous aider à analyser les performances sous un angle spécifique, que vous recherchiez les tendances générales, l'engagement dans les cours ou les progrès individuels.
Vue d'ensemble
L'onglet « Vue d'ensemble » fournit un résumé des principaux indicateurs de formation de votre organisation en un coup d'œil. Il affiche des données telles que le nombre total de cours attribués, les cours terminés, le taux moyen d'achèvement et le temps moyen nécessaire pour terminer les cours.
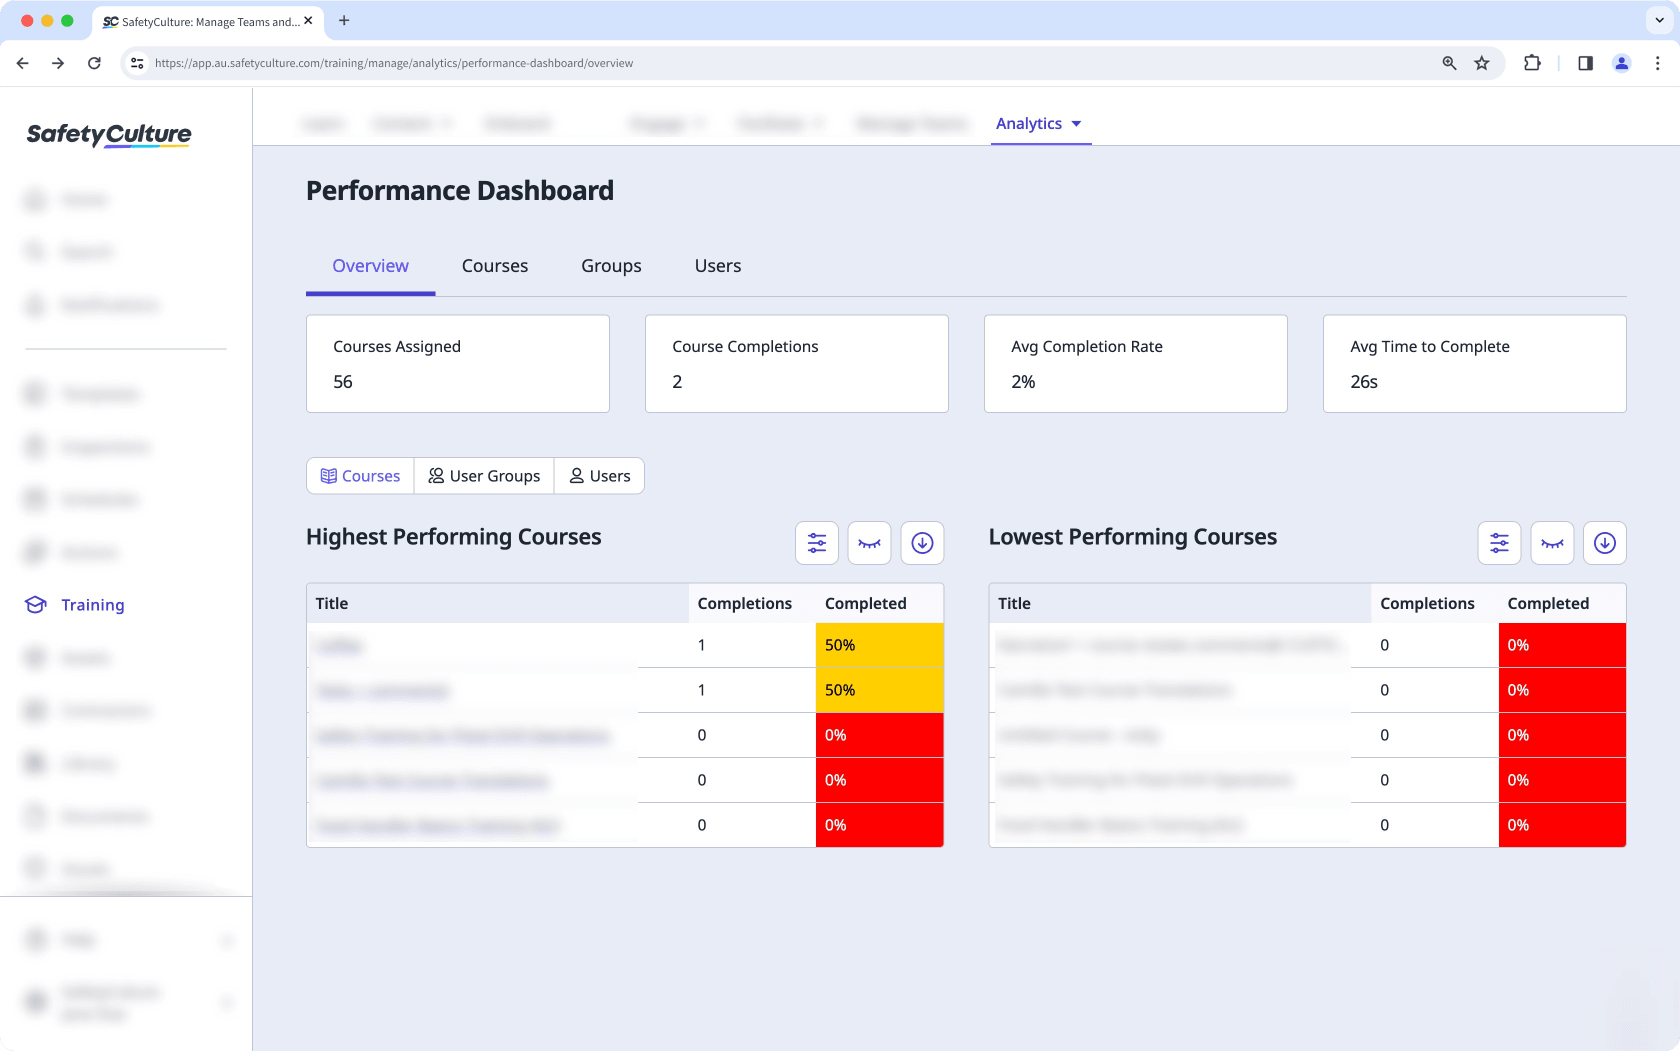
Sous ces métriques, vous pouvez consulter des informations sur les performances des cours, notamment les cours les plus performants et les moins performants, les groupes d'utilisateurs ou les utilisateurs en fonction des données d'achèvement. Cela vous aide à identifier rapidement les programmes de formation les plus efficaces et ceux qui pourraient être améliorés.
Cours
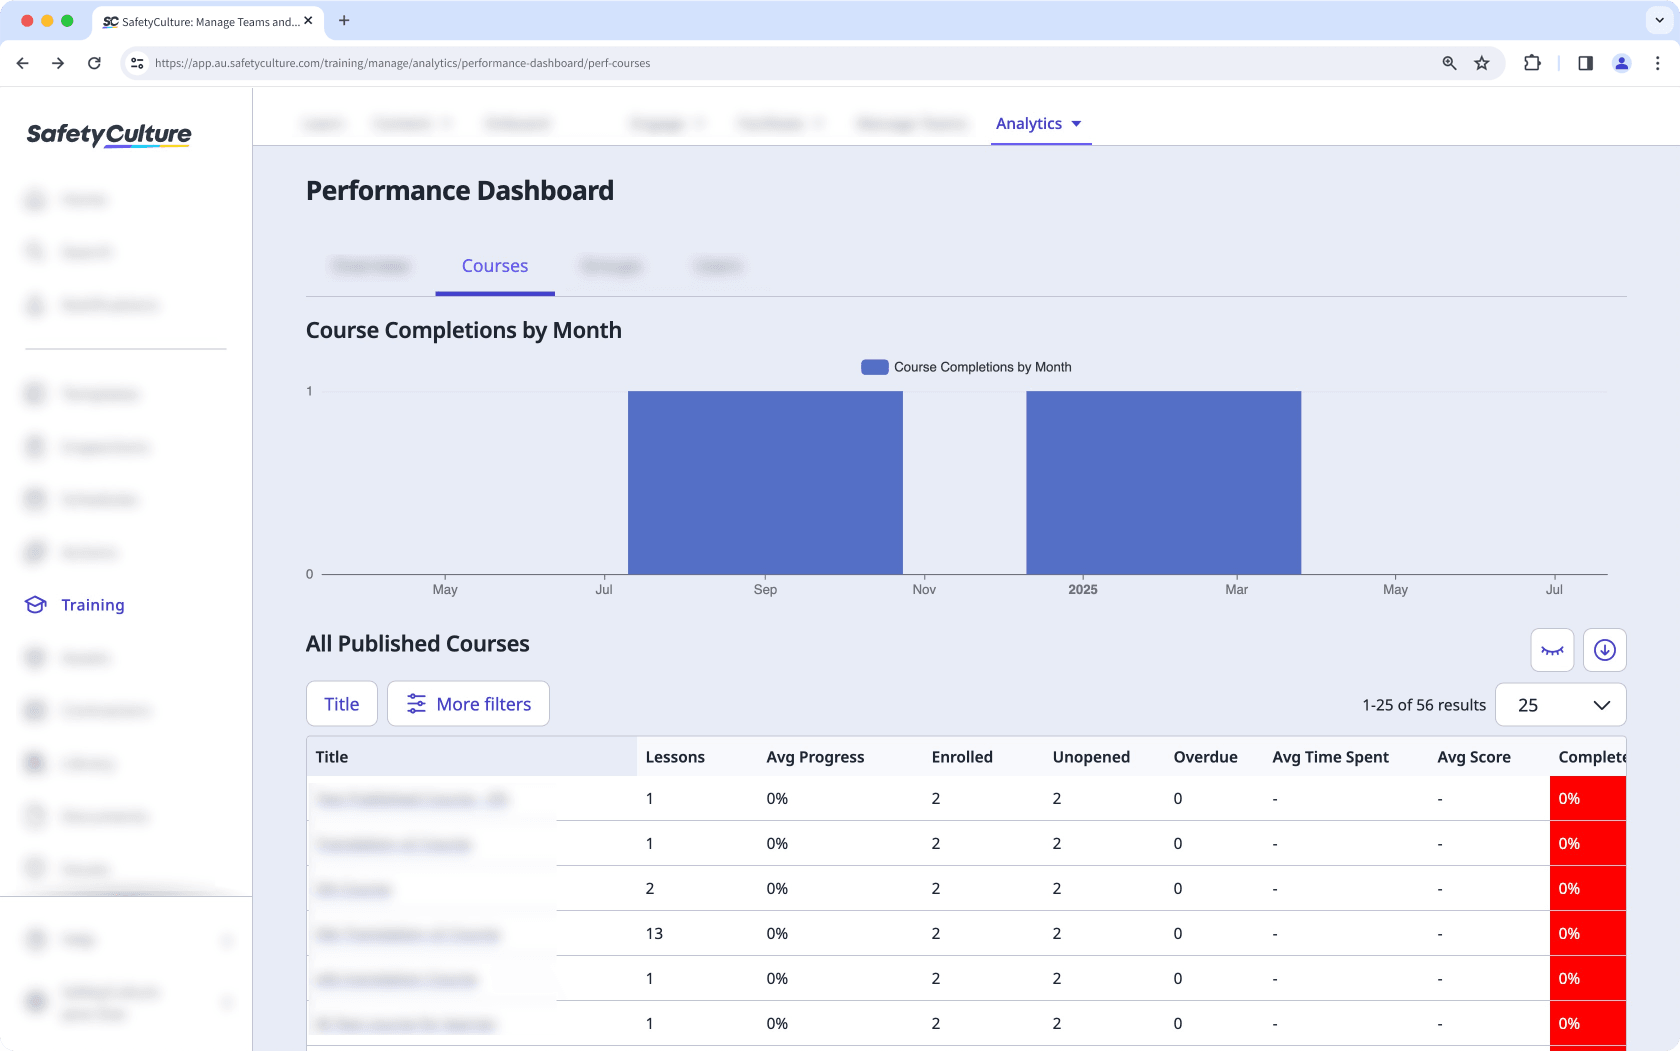
L'onglet « Cours » présente les mesures de tous les cours publiés dans votre organisation. Comme pour les options de l'onglet « Vue d'ensemble », vous pouvez afficher chaque cours en détail et recueillir des informations, notamment sur les points suivants :
Quels sont les cours sur lesquels les utilisateurs passent le plus de temps ?
Combien de tentatives ont été effectuées par chaque utilisateur pour un cours ?
Quelles sont les leçons pour lesquelles le nombre de réponses incorrectes est le plus élevé ?
Groupes et utilisateurs
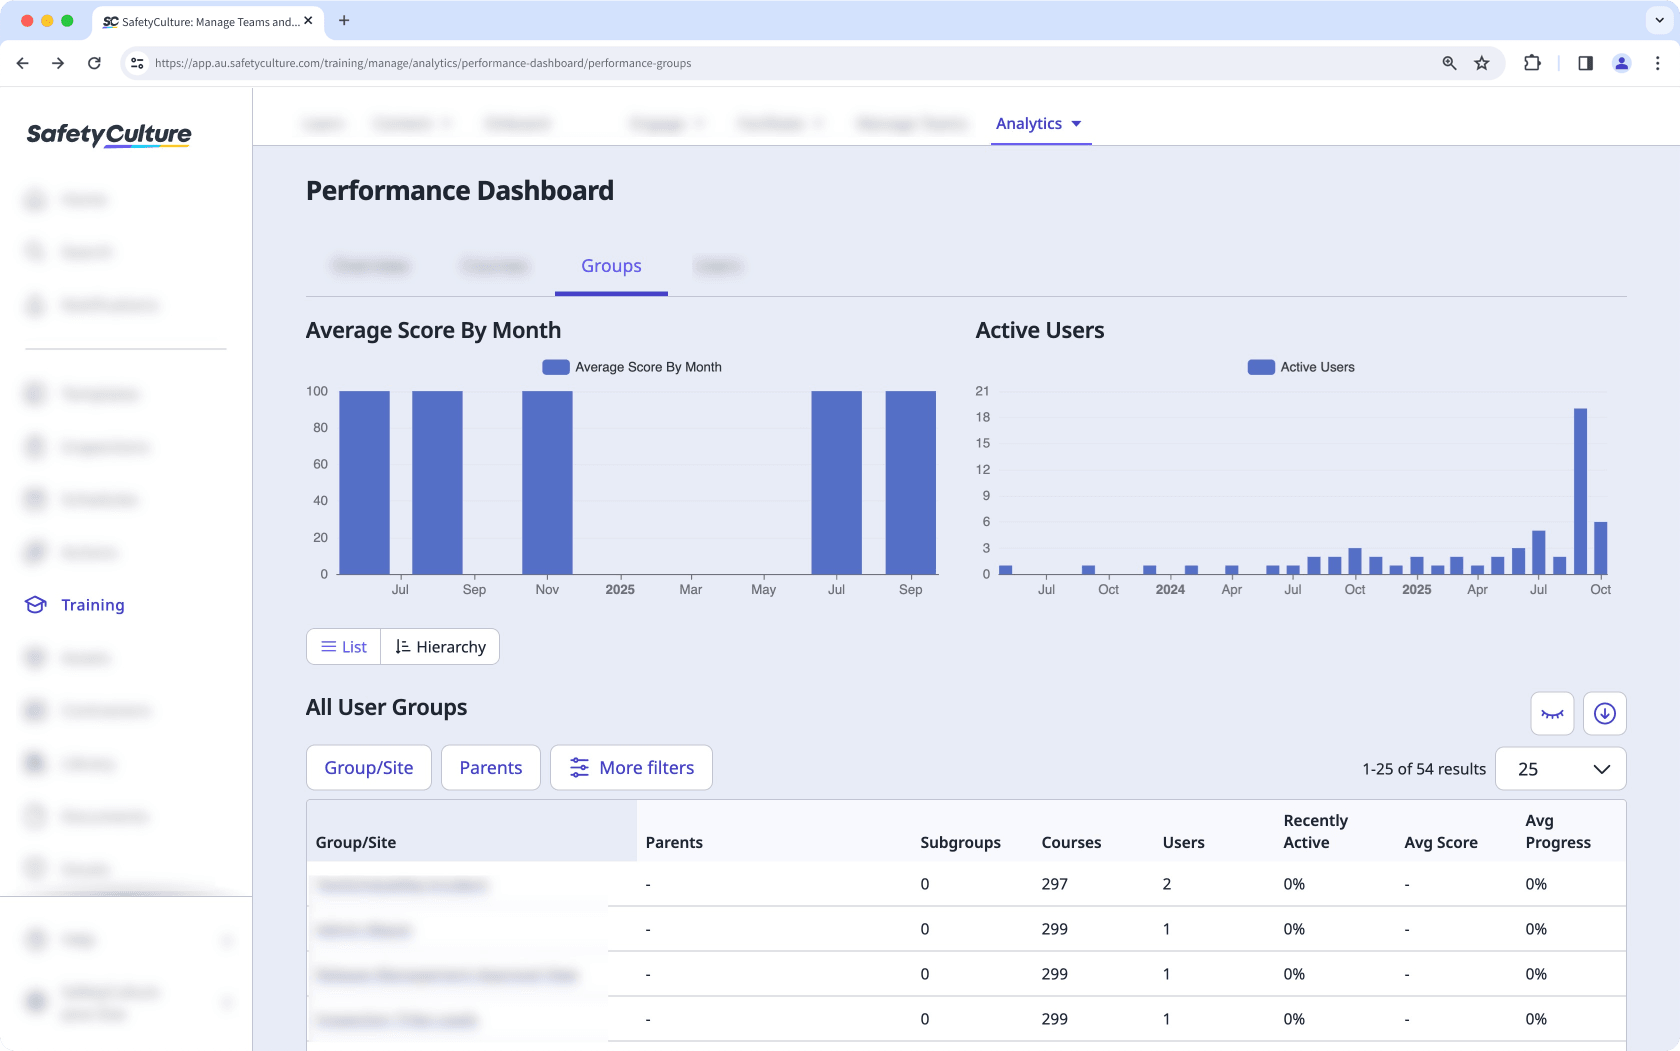
Les onglets « Groupes » et « Utilisateurs » vous permettent d'afficher les performances en matière de formation pour les groupes (et sites) et les utilisateurs de votre organisation. Si vous avez besoin d'examiner la progression de groupes et d'utilisateurs spécifiques, vous pouvez effectuer une analyse approfondie et découvrir les cours terminés par un groupe, ainsi que l'évolution de la formation de chaque utilisateur.
Filtrer les données par pertinence
Vous pouvez filtrer les données dans le tableau de bord des performances afin d'afficher les informations les plus pertinentes. Chaque onglet comprend son propre ensemble de filtres, ce qui vous permet d'affiner les résultats et de vous concentrer sur des cours, des groupes, des utilisateurs ou des périodes spécifiques.
Personnalisez la façon dont vous souhaitez afficher vos données de formation à l'aide des options suivantes :
Cliquez sur pour filtrer davantage vos résultats.
Cliquez sur pour afficher et masquer les colonnes dans les tableaux.
Cliquez sur pour exporter les données au format CSV.
Vue d'ensemble
Dans l'onglet « Vue d'ensemble », vous pouvez filtrer par type de cours pour afficher les cours obligatoires ou facultatifs. Cela vous aide à comparer les tendances en matière d'achèvement et l'engagement pour différents types de formation.
Cours
L'onglet « Cours » comprend plusieurs filtres qui vous permettent d'analyser en détail les performances des cours afin de suivre l'engagement des participants et d'identifier les cours qui fonctionnent bien ou qui pourraient nécessiter des mises à jour. Vous pouvez filtrer par :
Statut obligatoire (obligatoire ou facultatif)
Date de publication
Progrès moyen
Utilisateurs inscrits
Cours non ouverts
Temps moyen passé
Score moyen
Pourcentage terminé
Groupes
Dans l'onglet « Groupes », vous pouvez organiser et affiner les données par groupe/site ou groupe parent. Ces options vous aident à évaluer les performances de différentes équipes ou différents sites. Les filtres supplémentaires comprennent :
Statut obligatoire
Nombre de cours
Utilisateurs
Utilisateurs inactifs
Score moyen
Progrès moyen
Temps moyen passé
Taux d'achèvement
Utilisateurs
Dans l'onglet « Utilisateurs », vous pouvez utiliser le filtre Activité des utilisateurs pour afficher les utilisateurs récemment actifs ou inactifs. Cela permet d'identifier facilement le niveau d'engagement dans la formation et de repérer les utilisateurs qui pourraient avoir besoin d'une aide supplémentaire. Vous pouvez également filtrer par :
Statut obligatoire
Nom d'utilisateur ou nom complet
Cours attribués
Progrès moyen
Score moyen
Cours en retard
Visites lors des 30 derniers jours
Achèvements
Pourcentage terminé