¿Qué son las lecturas de activos?
Las lecturas de activos son medidas fundamentales que capturan el estado y el uso actuales de sus vehículos, maquinaria y equipamiento. Estas lecturas incluyen datos como distancias recorridas por el cuentakilómetros, las horas de tiempo de ejecución y las fechas de servicio, lo que proporciona una visión objetiva del estado y el rendimiento del activo. Contar con lecturas precisas y actualizadas permite que las organizaciones planifiquen el mantenimiento de forma proactiva, eviten averías inesperadas y optimicen la utilización de los activos. Tanto si utiliza inspecciones, dispositivos de seguimiento GPS conectados o integraciones telemáticas, dispone de flexibilidad para elegir la mejor forma de realizar el seguimiento del uso de los activos en SafetyCulture.
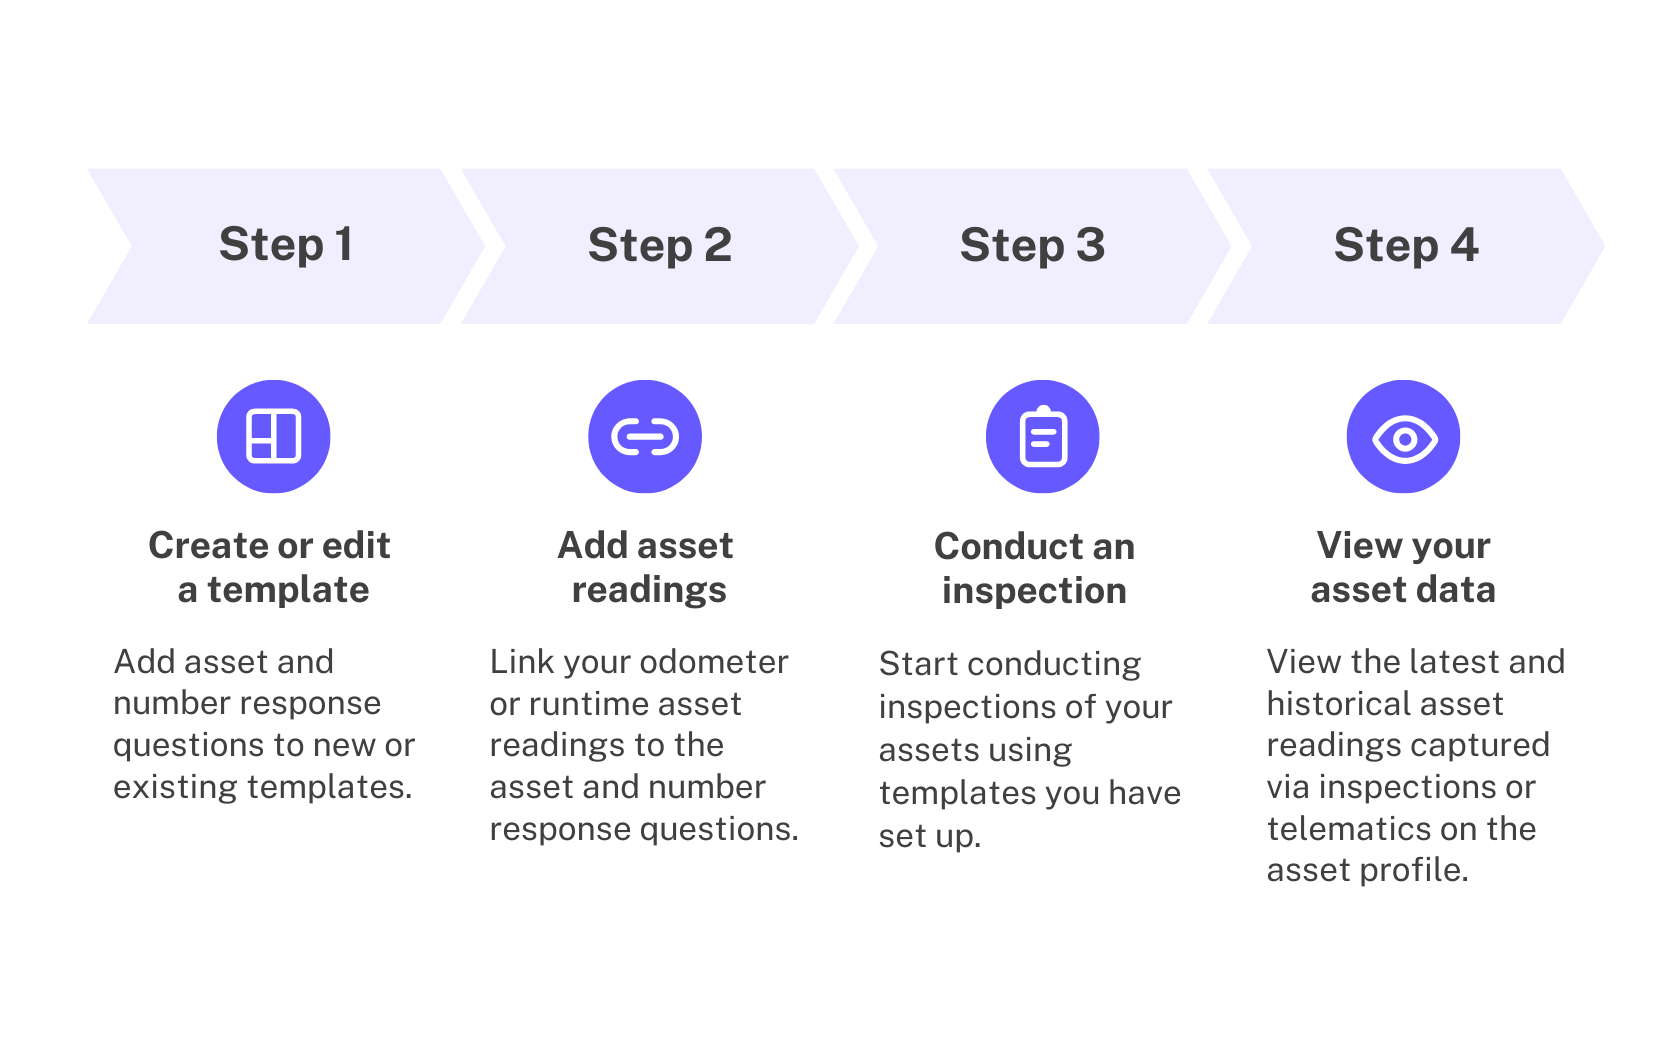
Cómo funciona
Este diagrama ilustra el proceso completo para configurar y gestionar lecturas de activos para maximizar plenamente la función en la plataforma.
Para ver las lecturas de activos y los datos de uso desde un perfil de activo, los usuarios necesitan tanto Permiso de "Activos: acceso" como Permiso para "Sensores: Acceso", incluso cuando las lecturas se registran mediante inspecciones en lugar de dispositivos conectados.
Lo que necesitarás
Si bien es posible crear plantillas en la aplicación móvil, recomendamos crear plantillas a través de la aplicación web para obtener la mejor experiencia.
Los cambios publicados realizados en las plantillas solo se aplican a las nuevas inspecciones en el futuro.
Gestionar lecturas de activos en una plantilla
Seleccione Plantillas en la barra lateral o selecciónelo en Más.
Haga clic en la plantilla y seleccione Editar plantilla en el panel lateral.
En la “Página de título”, añadir una pregunta de activos.
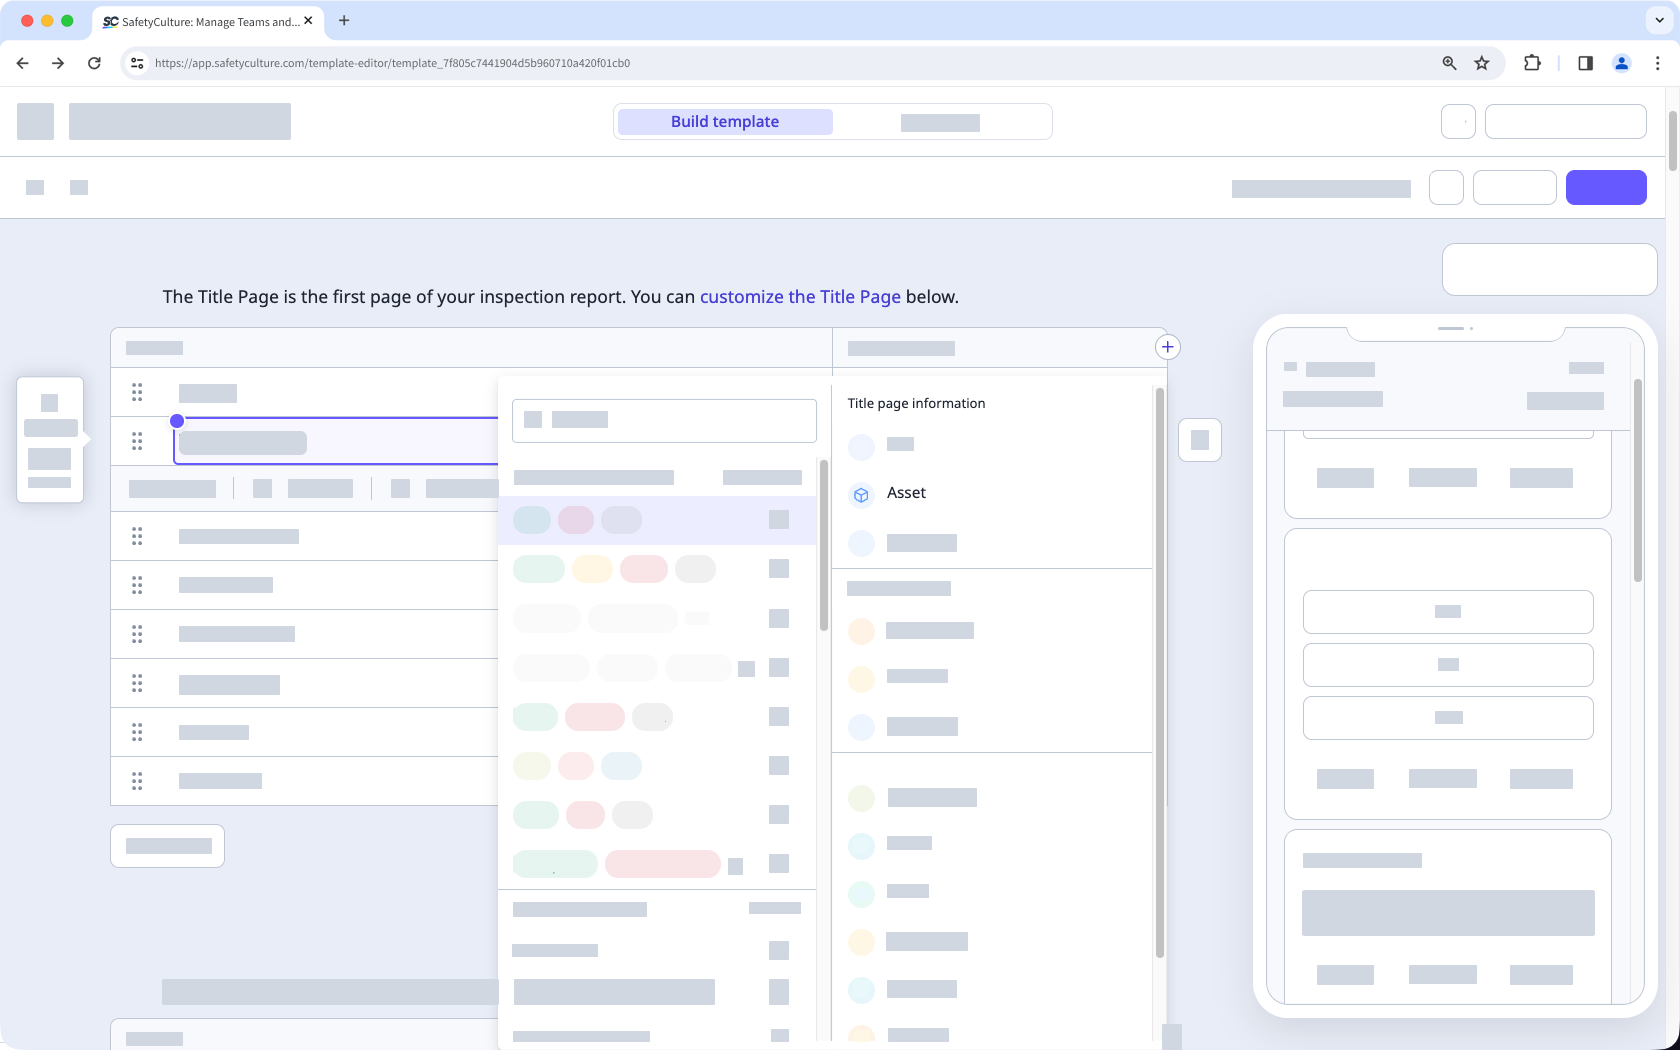
Añadir una nueva pregunta o seleccionar una existente.
Haga clic en en la columna "Tipo de respuesta" en el lado derecho y seleccione .
Añada más preguntas o edite las existentes según sea necesario.
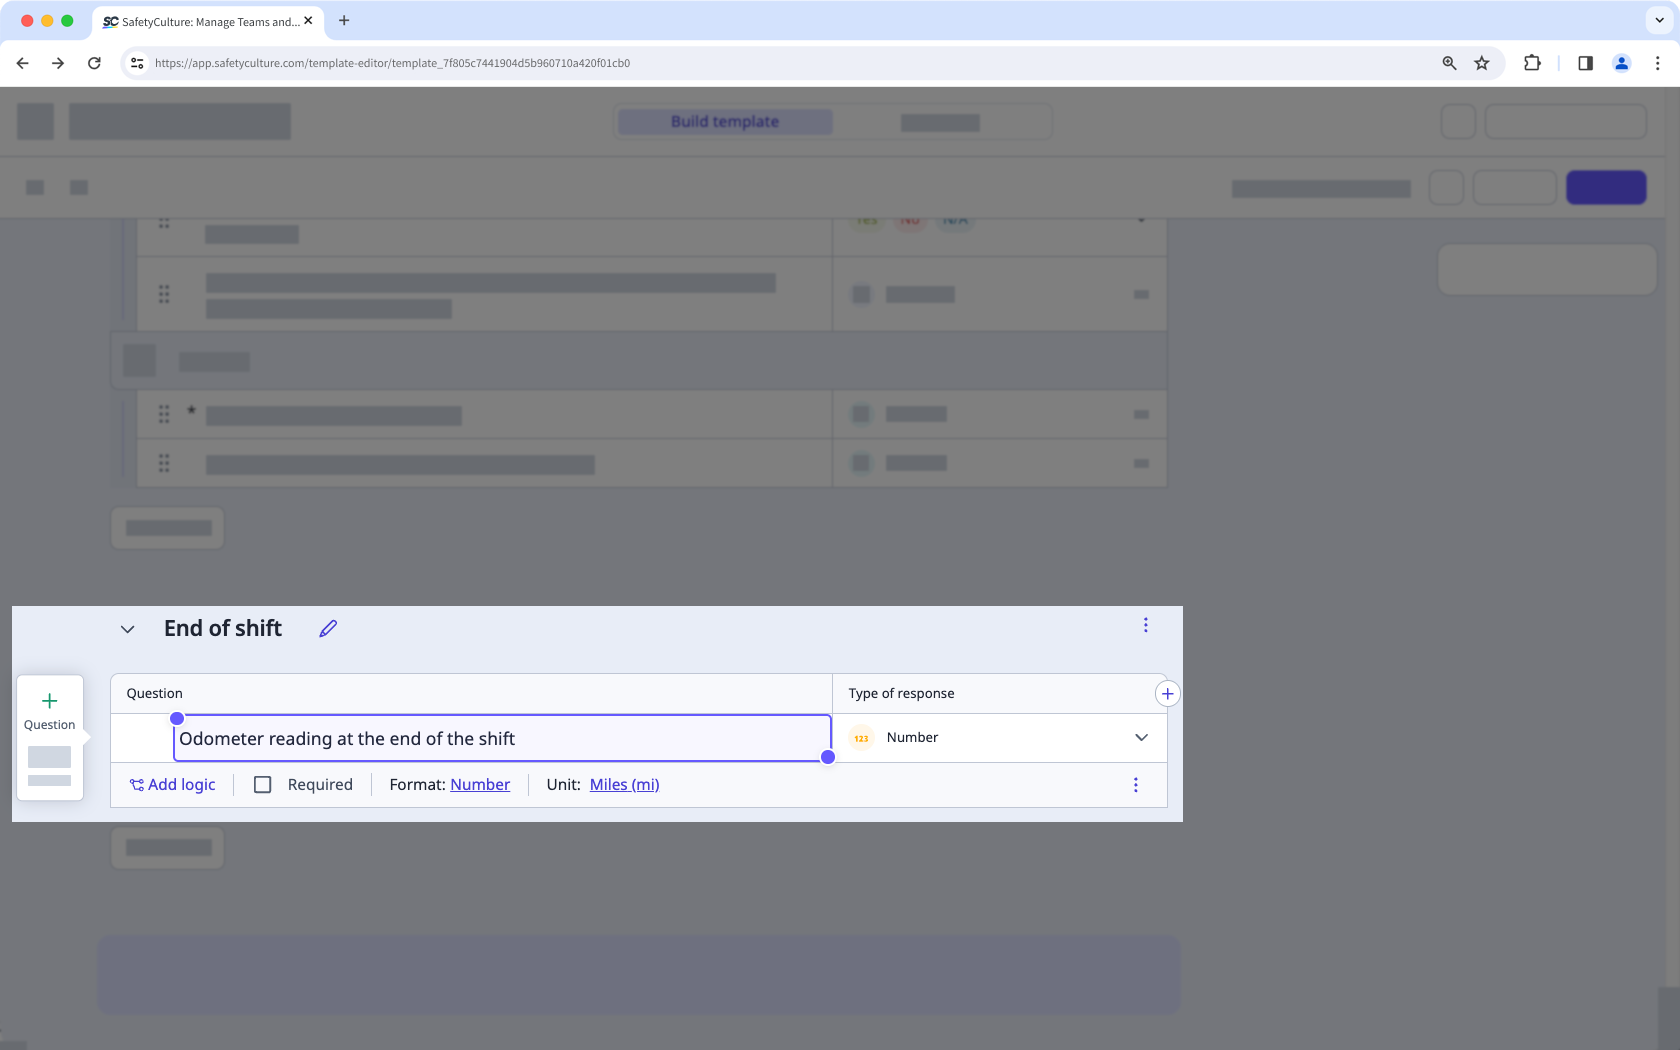
Capture lecturas de activos vinculando sus activos con preguntas de respuesta numérica.
Haga clic en la pregunta del activo y luego haga clic en Añadir junto a la opción de "Capturar lecturas".
En el panel lateral, seleccione una lectura del cuentakilómetros o del tiempo de ejecución con la unidad adecuada.
Seleccione la pregunta de respuesta numérica pertinente para vincularla a la lectura.
Haga clic en Vincular otra lectura para añadir más lecturas a la plantilla.
Haga clic en Guardar y aplicar.
Toque Publicar en la parte superior derecha de la pantalla para publicar la plantilla. Si no está lista para publicarse, puede volver a la lista de plantillas y regresar cuando esté listo.
¿Supervisa varias plantillas de activos? Gestione rápidamente todas las plantillas con preguntas sobre activos, incluidos tipos de activos y lecturas desde la página de ajustes de Activos.
Ejemplos
Si elimina una lectura vinculada a una plantilla, ya no podrá realizar un seguimiento del uso de activos para esa lectura en inspecciones futuras con la misma plantilla.