El artículo describe las funcionalidades de la nueva experiencia de Estadísticas, que seguimos mejorando continuamente. Si tiene algún comentario sobre la nueva experiencia de Estadísticas, nos encantaría escucharlo.
Si desea ver las estadísticas de la función Formación, obtenga más información sobre el panel de rendimiento.
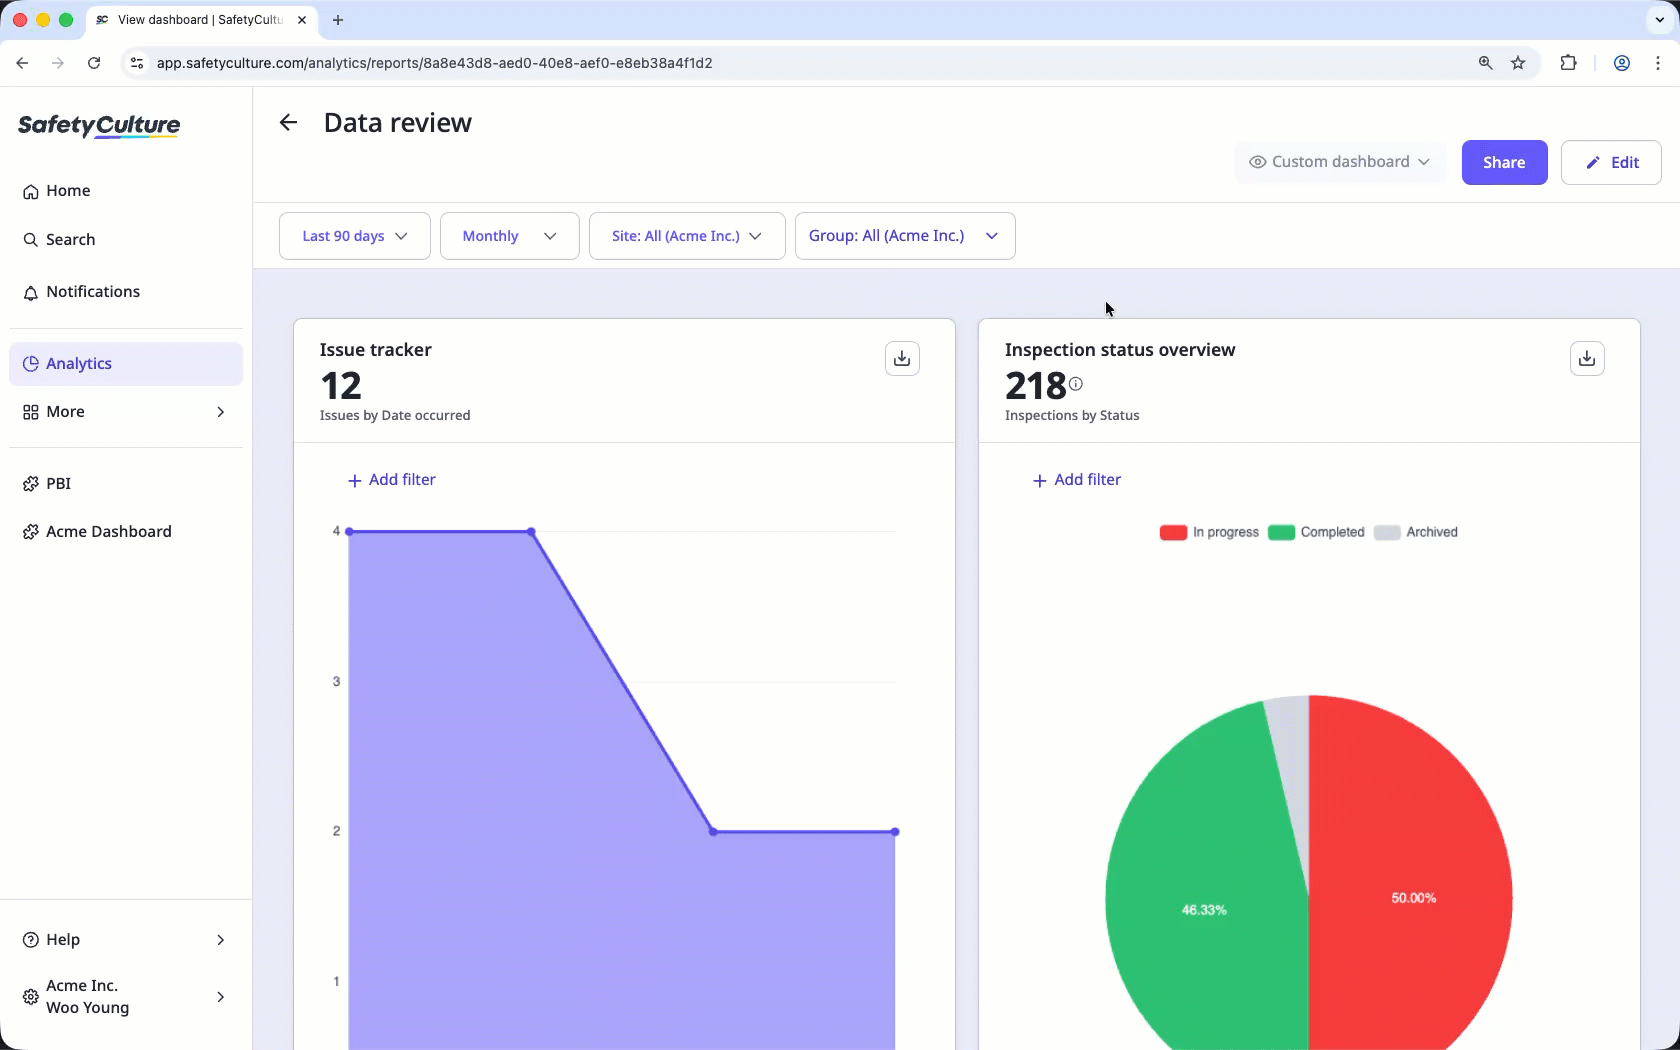
¿Qué es Estadísticas en SafetyCulture?
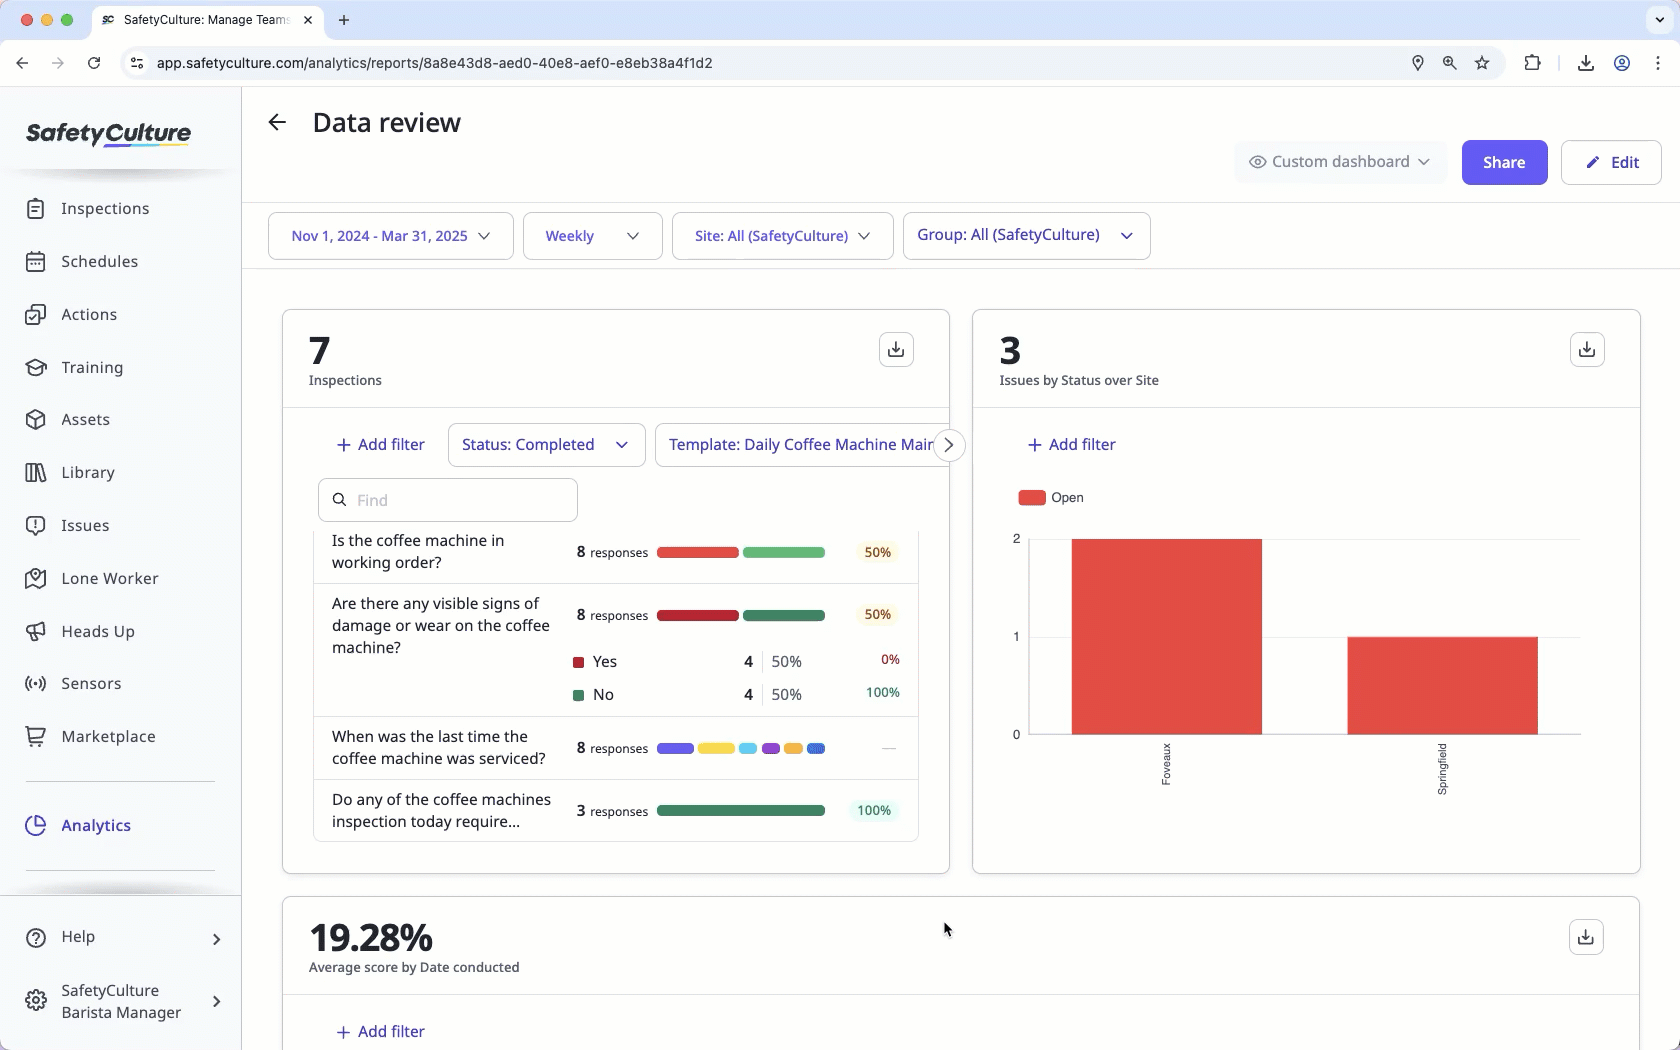
La función de Estadísticas de SafetyCulture le permite visualizar y comprender los datos que captura su equipo. Es recomendable cuando necesita una visibilidad clara de los KPI, tendencias de rendimiento o áreas específicas que requieren atención. Las Estadísticas funcionan a través de paneles personalizables, donde podrá elegir entre diferentes tipos de gráficos, personalizar cómo se muestran sus datos y controlar el acceso mediante permisos dedicados.
Por ejemplo, puede hacer un seguimiento de las puntuaciones de inspección en todos los sitios, supervisar las tasas de finalización de las acciones o revisar los datos creados a lo largo de un periodo de tiempo. También puede compartir paneles con su equipo o exportar datos para generar informes, lo que ayuda a los equipos a descubrir conocimientos, destacar oportunidades de mejora y tomar decisiones basadas en datos.
Explorar Estadísticas en SafetyCulture
Crear y compartir paneles
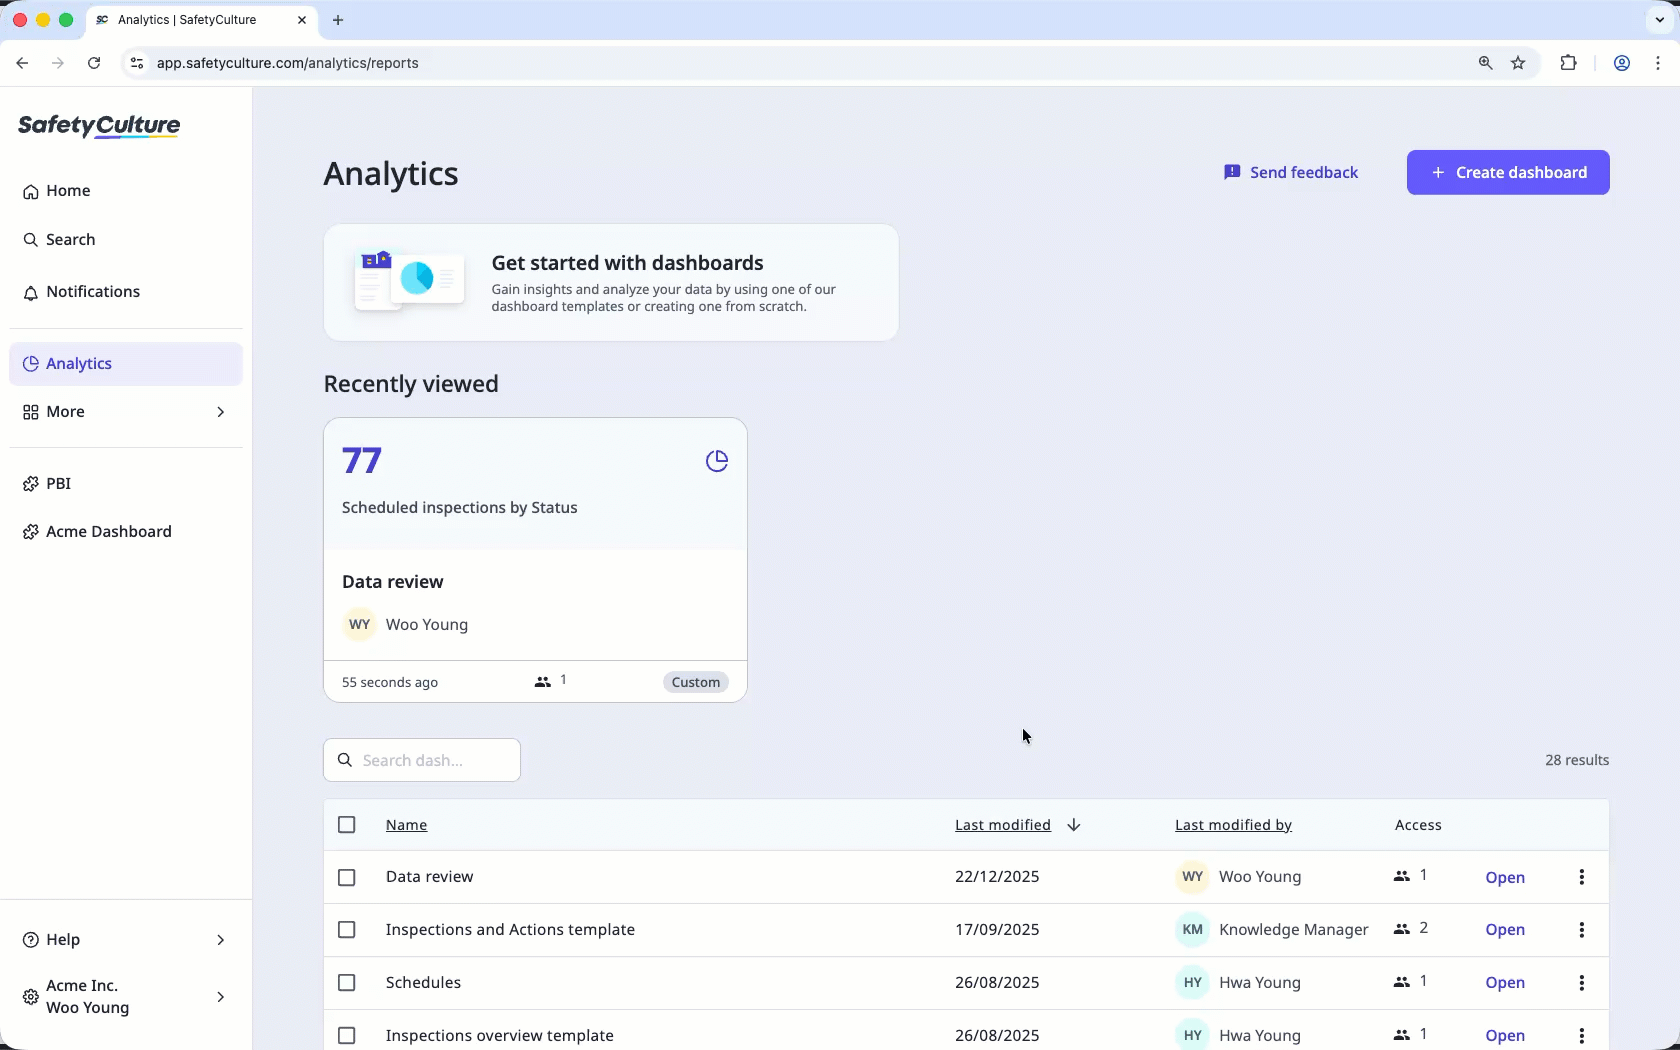
Estadísticas cuenta con una página de inicio donde puede ver todos los paneles a los que tiene acceso y crear nuevos paneles según sus necesidades. Esto le permite configurar diferentes tipos de paneles sin tener que reconfigurar gráficos ni filtros cada vez que visite Estadísticas o desee interpretar diferentes conjuntos de datos. También puede duplicar paneles y compartir los mismos conocimientos con diferentes miembros del equipo sin tener que reconstruir su configuración.
Para ayudarle a empezar con su panel, puede seleccionar uno que se adapte a sus necesidades de nuestras plantillas recomendadas con conjuntos de datos preseleccionados o iniciar uno desde cero.
Filtrado preciso de datos
Concéntrese en los conocimientos que más le importan mediante el uso de potentes paneles y filtros de gráficos para refinar su vista. Con los filtros del panel, puede optimizar rápidamente toda su página con criterios como rango de fechas, frecuencia, sitio o grupo, lo que garantiza que sus datos siempre sean relevantes para sus necesidades de informes. Para un análisis más detallado, también puede aplicar filtros de gráficos para profundizar en puntos de datos específicos y ajustar su selección con precisión. Al centrar su atención tanto a nivel de panel como de gráficos, puede apartar lo irrelevante y obtener la información exacta que necesita para impulsar mejoras en toda su organización.
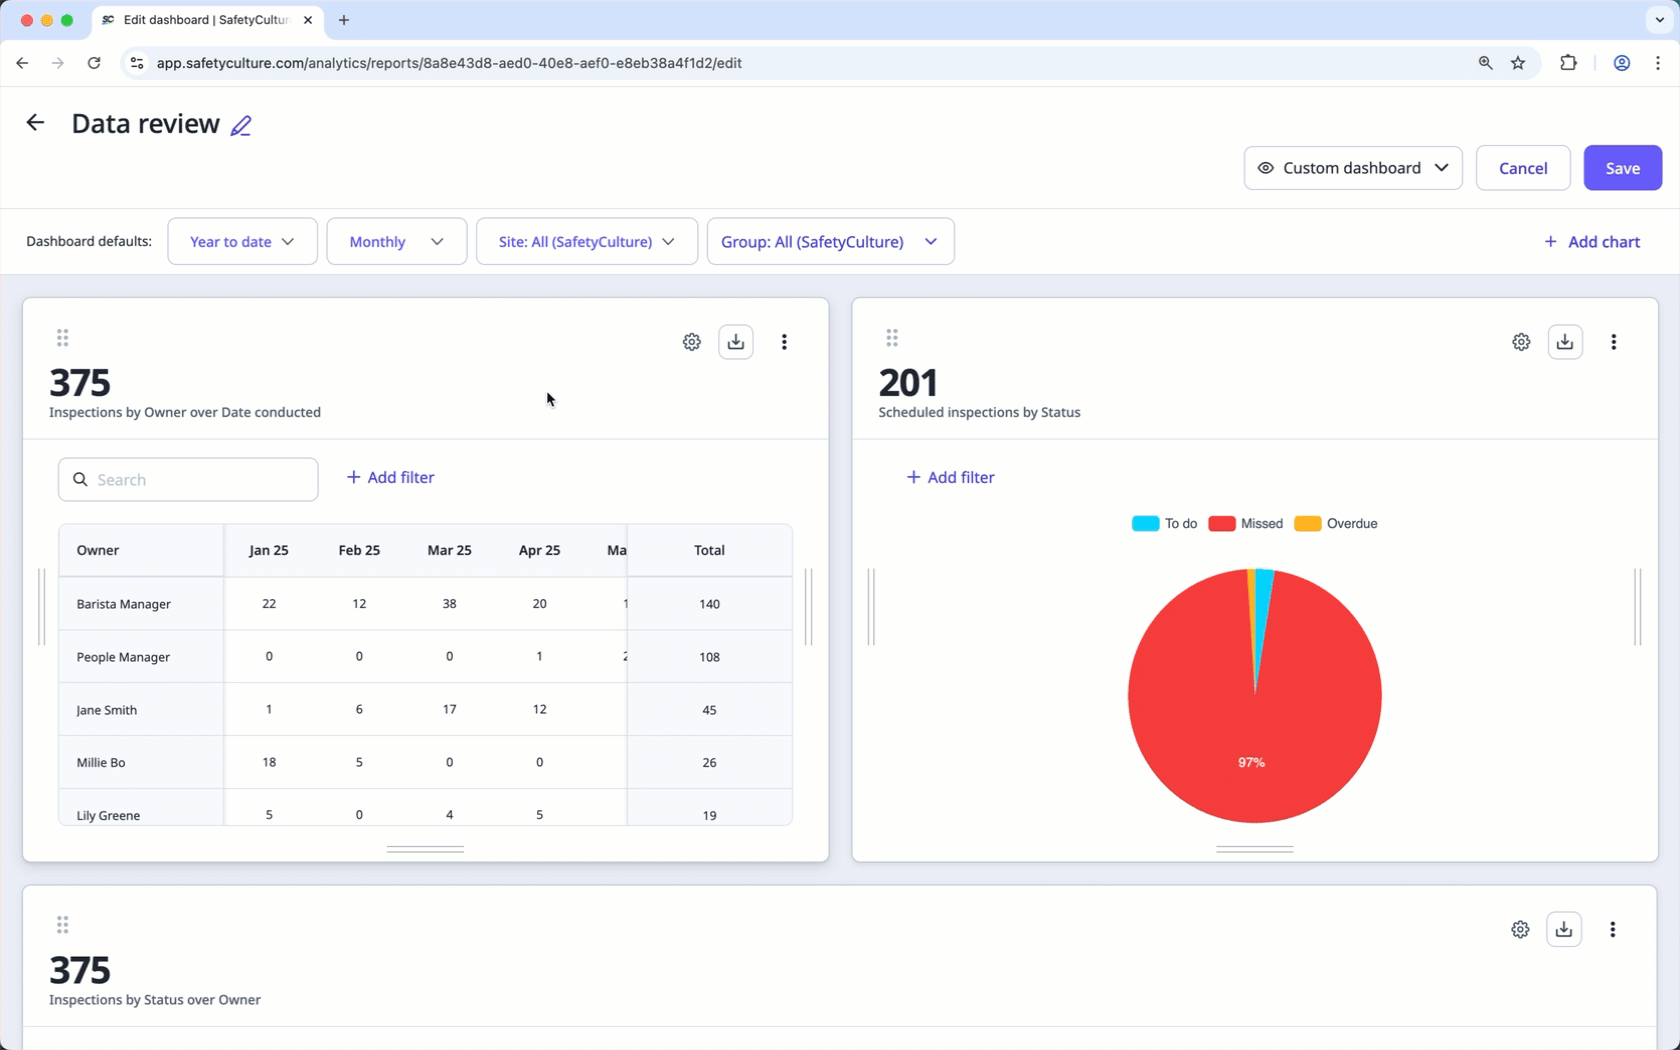
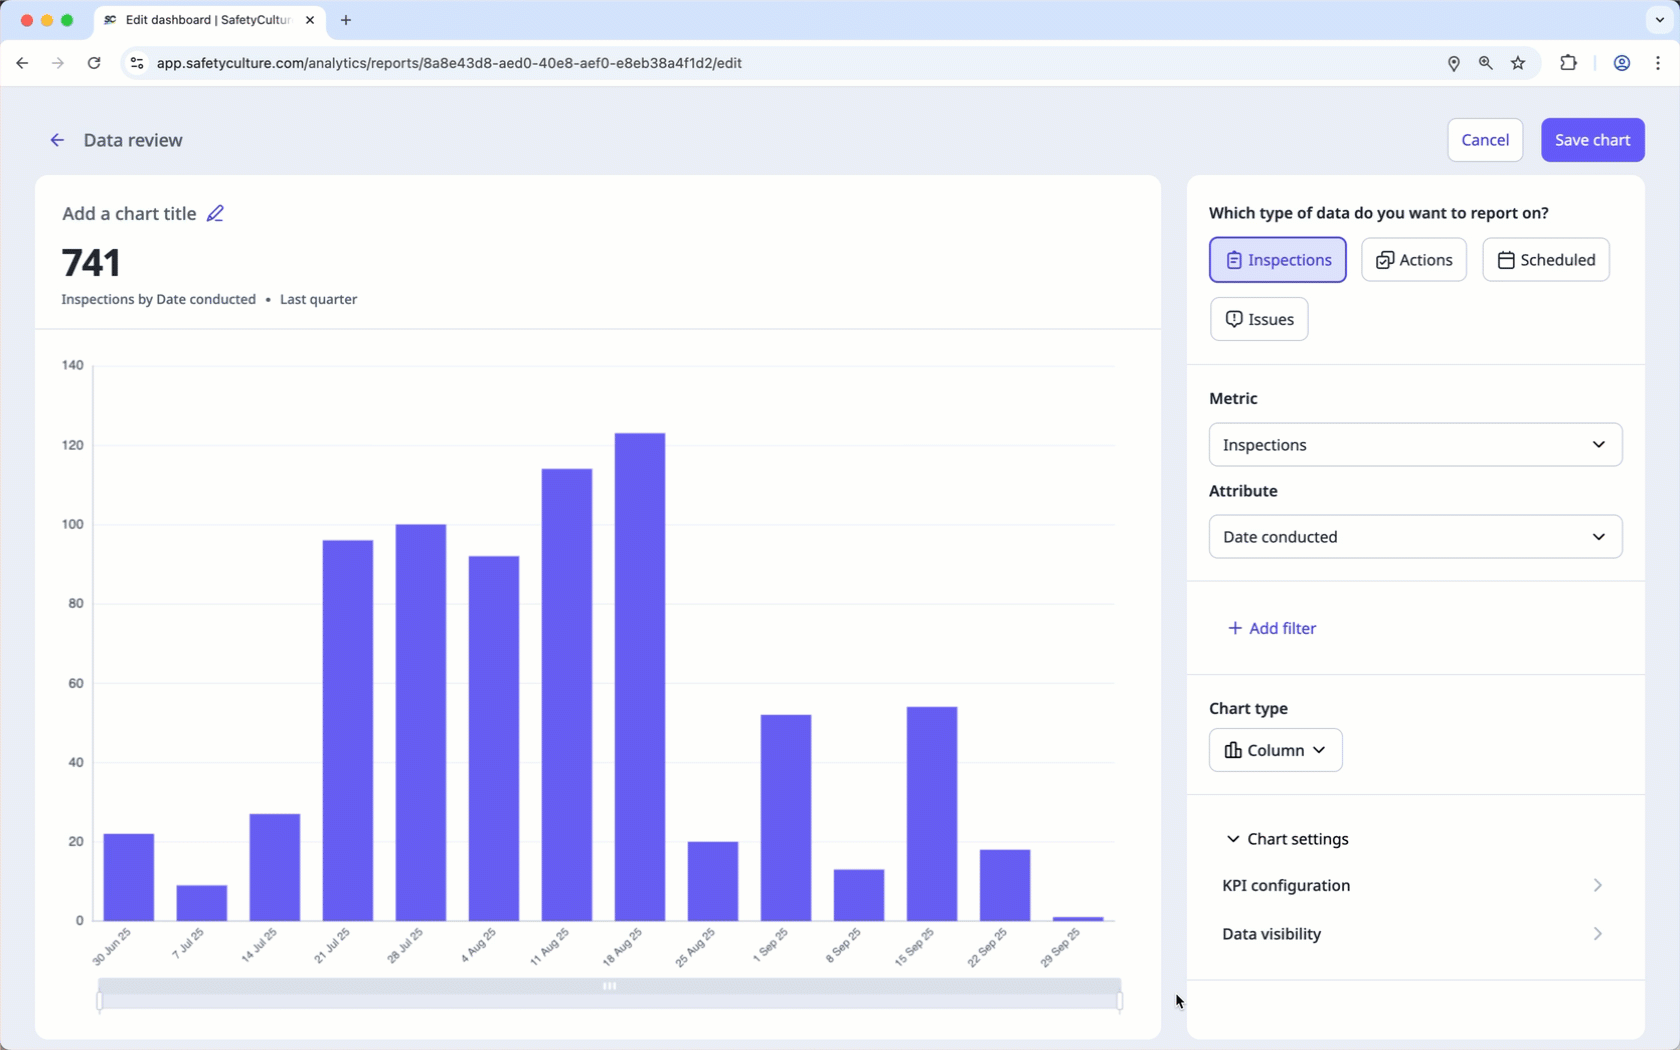
Gráficos personalizables
Visualice su rendimiento exactamente como desee con la personalización flexible de gráficos. Combinando métricas y atributos específicos, puede personalizar sus gráficos para adaptarlos a su tipo de datos y convertir la información en bruto en acciones significativas. Seleccione el tipo de gráfico que mejor se adapte a sus necesidades y configure los KPI para supervisar el progreso con respecto a sus objetivos en tiempo real.
Por ejemplo, puede realizar un seguimiento de la cantidad de inspecciones realizadas a lo largo del tiempo para garantizar que sus equipos cumplan constantemente los objetivos establecidos y se mantengan encaminados hacia el éxito.
Compartir paneles
Una vez que haya configurado su panel de Estadísticas para que se adapte a su caso de uso específico, puede compartirlo de forma selectiva con grupos o con toda su organización. Compartir sus paneles permite a sus equipos disponer de los datos que necesitan para mantenerse alineados y tomar decisiones informadas que impulsen el rendimiento de la seguridad y la calidad. Tanto si proporciona un resumen para el equipo directivo como si genera un enlace para compartir con miembros específicos del equipo, la gestión del acceso garantiza que la información correcta llegue a las personas adecuadas en el momento oportuno.
Exportación de datos
Puede exportar datos de Estadísticas de varias formas. Descargue gráficos como imágenes o archivos CSV, o exporte tipos de datos como inspecciones, acciones, contratiempos, avisos y programas en masa para un análisis más detallado.
También puede exportar todo su panel de Estadísticas como una instantánea de todos sus gráficos, para que su equipo pueda compartir informes o revisar tendencias fuera de la plataforma.