- Usar SafetyCulture
- Estadísticas
- ¿Qué es el panel de rendimiento?
¿Qué es el panel de rendimiento?
Más información sobre el panel de rendimiento y cómo usarlo para supervisar el progreso en la formación de su equipo.¿Qué es el panel de rendimiento?
El panel de rendimiento ofrece una vista detallada del progreso y la participación de su organización para la función de Formación. Desde un resumen general de la tasa de finalización de cursos y el rendimiento, hasta un desglose del rendimiento (puntuación y finalización) a nivel de curso, grupo y usuario; puede recopilar información sobre qué estrategia de formación está funcionando y perfeccionar su contenido con el tiempo para mejorar el aprendizaje del equipo continuamente.
El panel de rendimiento le ofrece una vista detallada del rendimiento de la formación en su organización. Si desea una vista simple del progreso individual de los miembros de su equipo en el curso, considere usar la matriz de formación o la finalización del curso por parte de los usuarios.
Explorar el panel de rendimiento en SafetyCulture
Vea sus datos
El panel de rendimiento le ofrece una visión clara de la actividad y los resultados de la formación de su organización. Está organizado en diferentes pestañas, cada una diseñada para ayudarle a analizar el rendimiento desde una perspectiva específica, ya sea que esté observando las tendencias generales, la participación en los cursos o el progreso individual.
Resumen
La pestaña de "Resumen" ofrece una visión general de las principales métricas de formación de su organización. Muestra datos como el número total de cursos asignados, las finalizaciones de los cursos, el promedio de finalización y el tiempo promedio para completar los cursos.
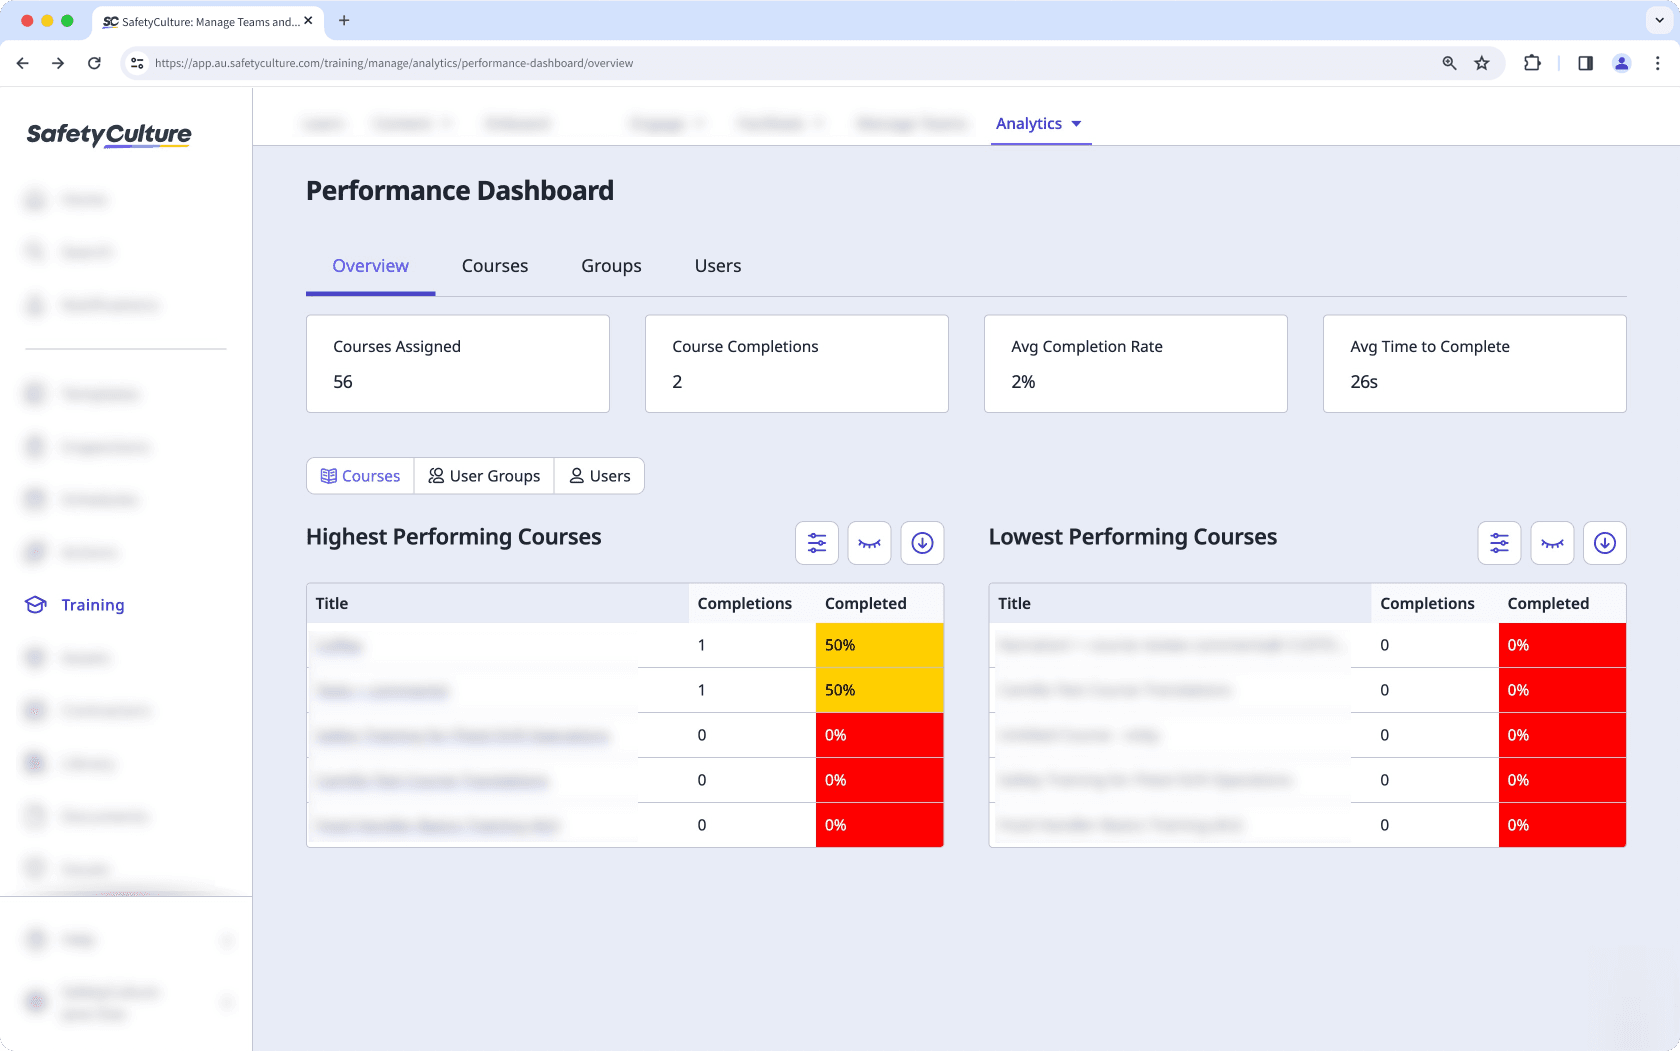
En estas métricas, puede ver información sobre el rendimiento de los cursos, incluyendo los cursos, grupos de usuarios o usuarios con mejor y peor rendimiento, según los datos de finalización. Esto le ayuda a identificar rápidamente qué esquemas de formación son más eficaces y cuáles pueden necesitar mejoras.
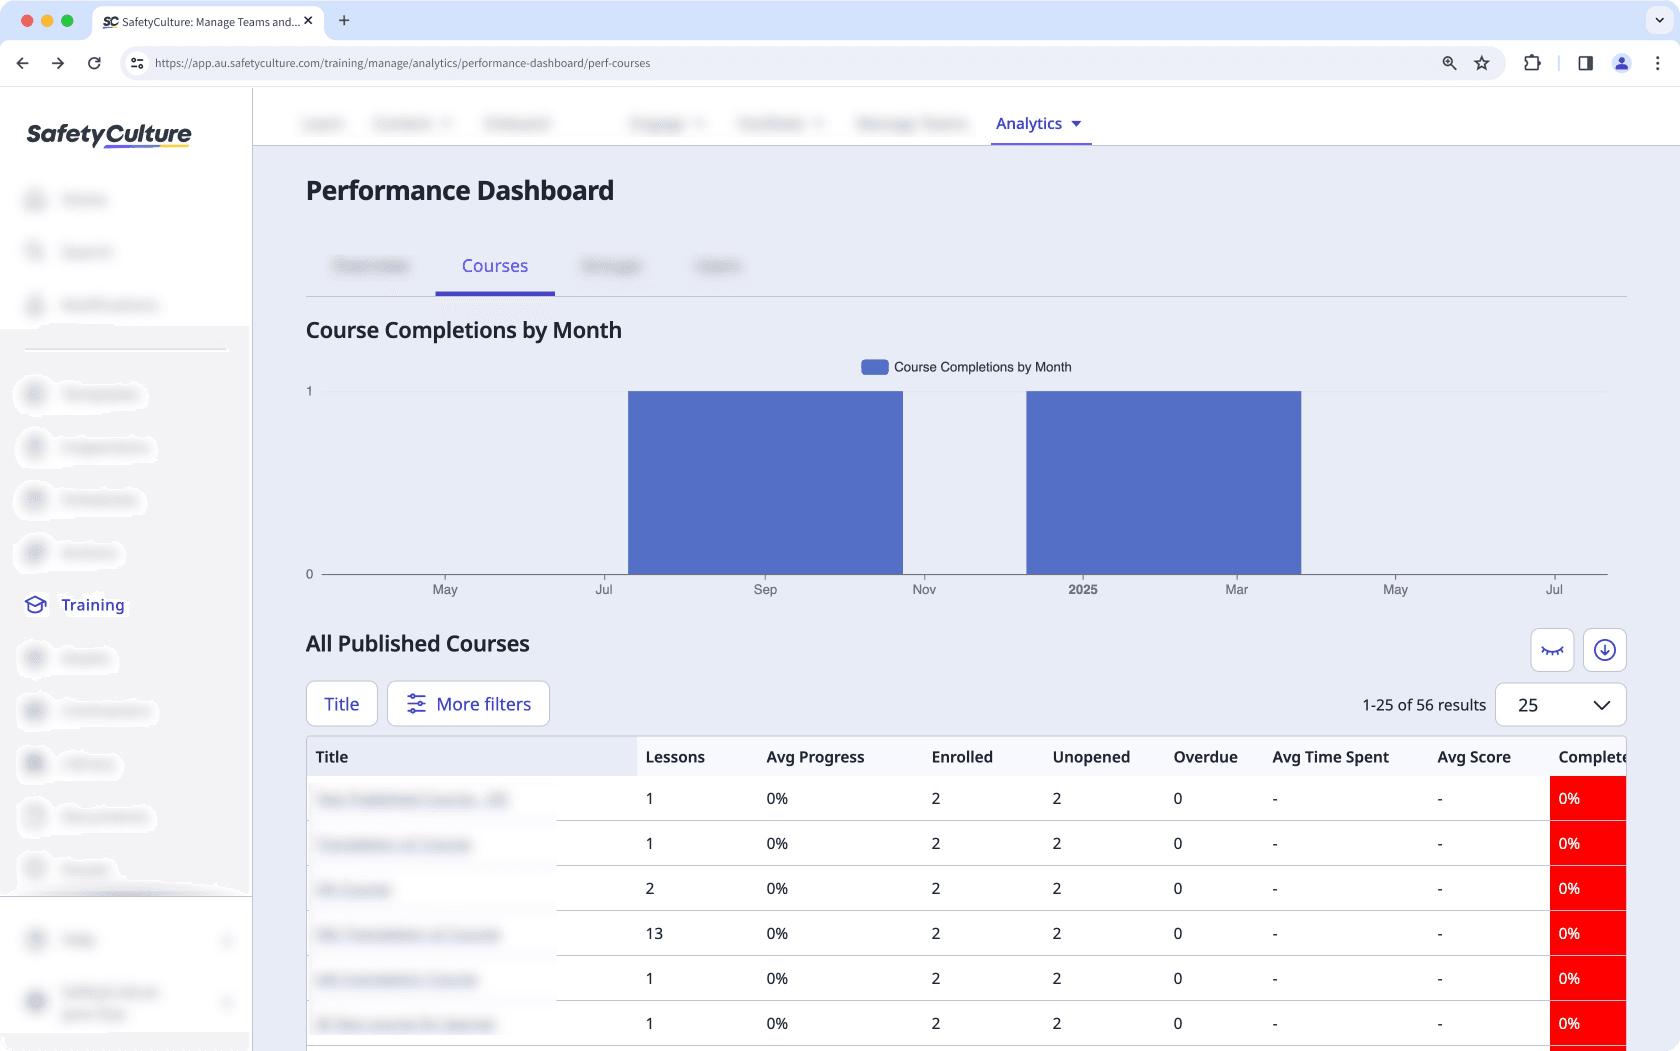
Cursos
La pestaña de "Cursos" describe las métricas de todos los cursos publicados en su organización. De manera similar a las opciones de profundización en la pestaña de "Resumen", puede ver cada curso en profundidad y recopilar información, que incluye:
¿A qué cursos dedican más tiempo los usuarios?
¿Cuántos intentos realizó cada usuario para un curso?
¿Qué lecciones están obteniendo el mayor número de respuestas incorrectas?
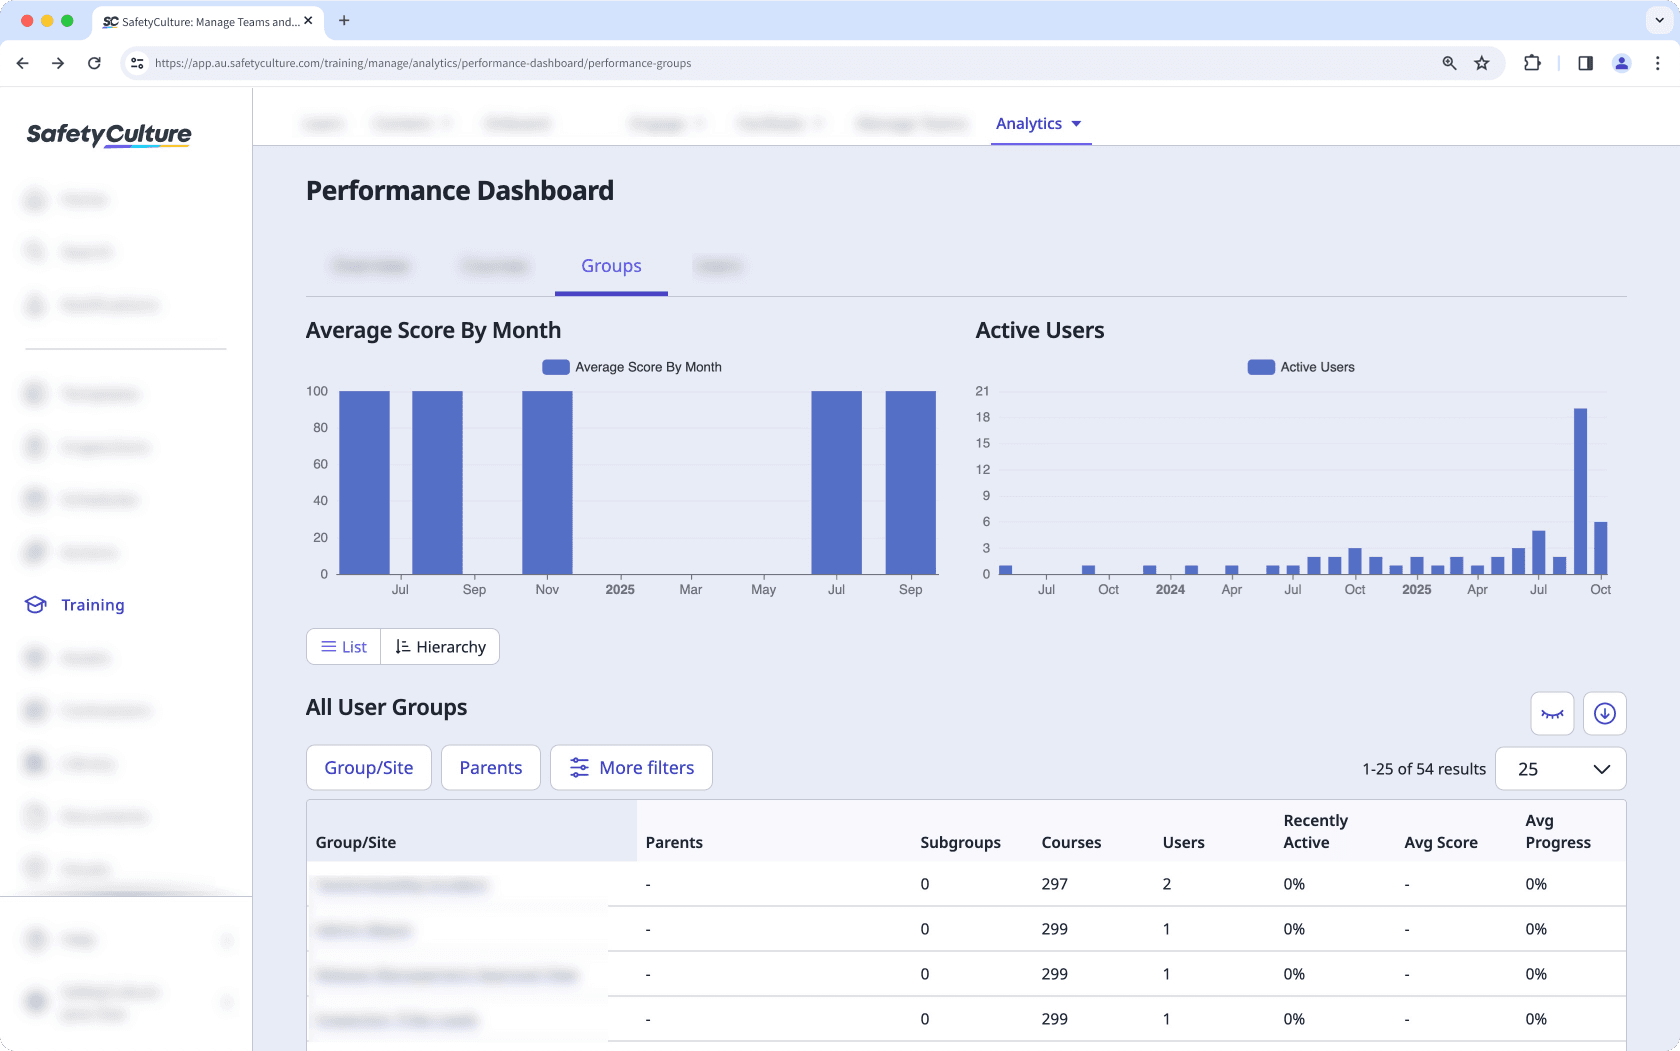
Grupos y usuarios
Las pestañas de "Grupos" y "Usuarios" le permiten ver el rendimiento de la formación para grupos (y sitios) y usuarios de su organización. Si necesita analizar el progreso de grupos y usuarios específicos, puede profundizar y descubrir qué cursos ha completado un grupo, así como la manera en la que está evolucionando cada usuario con su formación.
Filtrar datos por relevancia
Puede filtrar los datos en el panel de rendimiento para ver la información que más le interesa. Cada pestaña incluye su propio conjunto de filtros, lo que le permite refinar los resultados y centrarte en cursos, grupos, usuarios o periodos de tiempo específicos.
Personalice cómo quiere ver sus datos de formación utilizando las siguientes opciones:
Haga clic en
 para delimitar sus resultados.
Haga clic en
 para mostrar y ocultar las columnas en las tablas.
Haga clic en
 para exportar los datos como CSV.
Resumen
En la pestaña de "Resumen", puede filtrar por tipo de curso para mostrar los cursos obligatorios u opcionales. Esto le ayuda a comparar las tendencias de finalización y la participación en los diferentes tipos de formación.
Cursos
La pestaña de "Cursos" incluye varios filtros que permiten analizar el rendimiento de los cursos al detalle para realizar un seguimiento de la participación en la formación e identificar qué cursos funcionan bien o cuáles pueden necesitar actualizaciones. Puede filtrar por:
Estado obligatorio (obligatorio u opcional)
Fecha de publicación
Progreso promedio
Usuarios inscritos
Cursos sin abrir
Tiempo promedio dedicado
Puntuación media
Porcentaje completado
Grupos
En la pestaña de "Grupos", puede organizar y refinar los datos por Grupo/Sitio o Grupo principal. Estas opciones le ayudan a evaluar el rendimiento en diferentes equipos o ubicaciones. Los filtros adicionales incluyen:
Estado obligatorio
Número de cursos
Usuarios
Usuarios inactivos
Puntuación media
Progreso promedio
Tiempo promedio dedicado
Tasa de finalización
Usuarios
En la pestaña de "Usuarios", puede usar el filtro de Actividad del usuario para ver los usuarios que han estado activos o inactivos recientemente. Esto facilita la identificación de la participación en la formación y la detección de usuarios que puedan necesitar ayuda adicional. También puede filtrar por:
Estado obligatorio
Nombre de usuario o nombre completo
Cursos asignados
Progreso promedio
Puntuación media
Cursos vencidos
Visitas en los últimos 30 días
Finalizaciones
Porcentaje completado
¿Esta página le fue de ayuda?
Gracias por hacérnoslo saber.