Was bedeutet es, die Inspektionsantworten in Analysen zu verfolgen?
Der Diagrammtyp „Antworttabelle“ bietet eine detaillierte Ansicht, wie die Fragen bei den Inspektionen der einzelnen Vorlagen beantwortet wurden, und liefert wertvolle Einblicke in Inspektionstrends. Durch das Verfolgen von Inspektionsantworten können Sie sehen, wie oft jede Antwort bei jeder Frage ausgewählt wurde. So lassen sich Muster und gemeinsame Erkenntnisse über mehrere Inspektionen hinweg erkennen.
Zusätzlich können Sie mit Inspektionsaufschlüsselungen einzelne Inspektionen auf bestimmten Antworten basierend auflisten. So können Sie die Leistung Ihres Teams über Standorte, Abschnitte und Fragen hinweg anzeigen, was die Datenanalyse erleichtert, wiederkehrende Probleme sichtbar macht und fundierte Entscheidungen unterstützt.
Was Sie brauchen
Um das Beste aus Ihren Daten herauszuholen, empfehlen wir, Bewertungen für Ihre Fragen sowie benutzerdefinierte Antwort-Sets einzurichten.
Inspektionsantworten verfolgen
Wählen Sie Analysen in der Seitenleiste oder in Mehr aus.
Fügen Sie hinzu oder bearbeiten Sie ein bestehendes Diagramm.
Konfigurieren Sie im Diagrammersteller das Diagramm folgendermaßen:
Datentyp: Wählen Sie oben rechts auf der Seite Inspektionen aus.
Messeinheit: Wählen Sie aus dem Drop-down-Menü Inspektionen aus.
Diagrammtyp: Wählen Sie
 Typ (Aktionen) aus dem Drop-down-Menü aus.
Vorlage: Klicken Sie auf Vorlage auswählen und wählen Sie die Vorlage, für die Sie eine Antwortaufschlüsselung anzeigen möchten.
Klicken Sie oben rechts auf der Seite auf Diagramm speichern.
Klicken Sie oben rechts auf der Seite auf Speichern, um die Änderungen in Ihrem Dashboard zu speichern.
Sie können nach bestimmten oder markierten Antworten filtern, um Ihre Inspektionen weiter einzugrenzen und tiefere Einblicke zu erhalten.
Unterstützte Antworttypen und Diagrammkonfigurationen
Antworttypen
Person
Filter für Diagramme
Text-Antwort
Zahl
Schieberegler
Kontrollkästchen
Metrik
Inspektionen
Durchschnittliche Dauer
Durchschnittliche Bewertung
Markierte Antworten
Markierungsrate
Inspektionsabschlussrate
Filter für Diagramme
Status
Vorlagen
Mit diesem Feld können Sie ein Asset auswählen, das Sie mit einer Inspektion verknüpfen möchten. Dadurch wird sichergestellt, dass Daten einheitlich mit denselben Assets verknüpft werden und Asset-Management und -Wartung effizienter werden.
Bitte beachten Sie, dass sich die Messwerte nur auf den Wert oben links im Diagramm beziehen, nicht auf den eigentlichen Inhalt der Antworttabelle.
Wie werden die Prozentsätze in Antworttabellen berechnet?
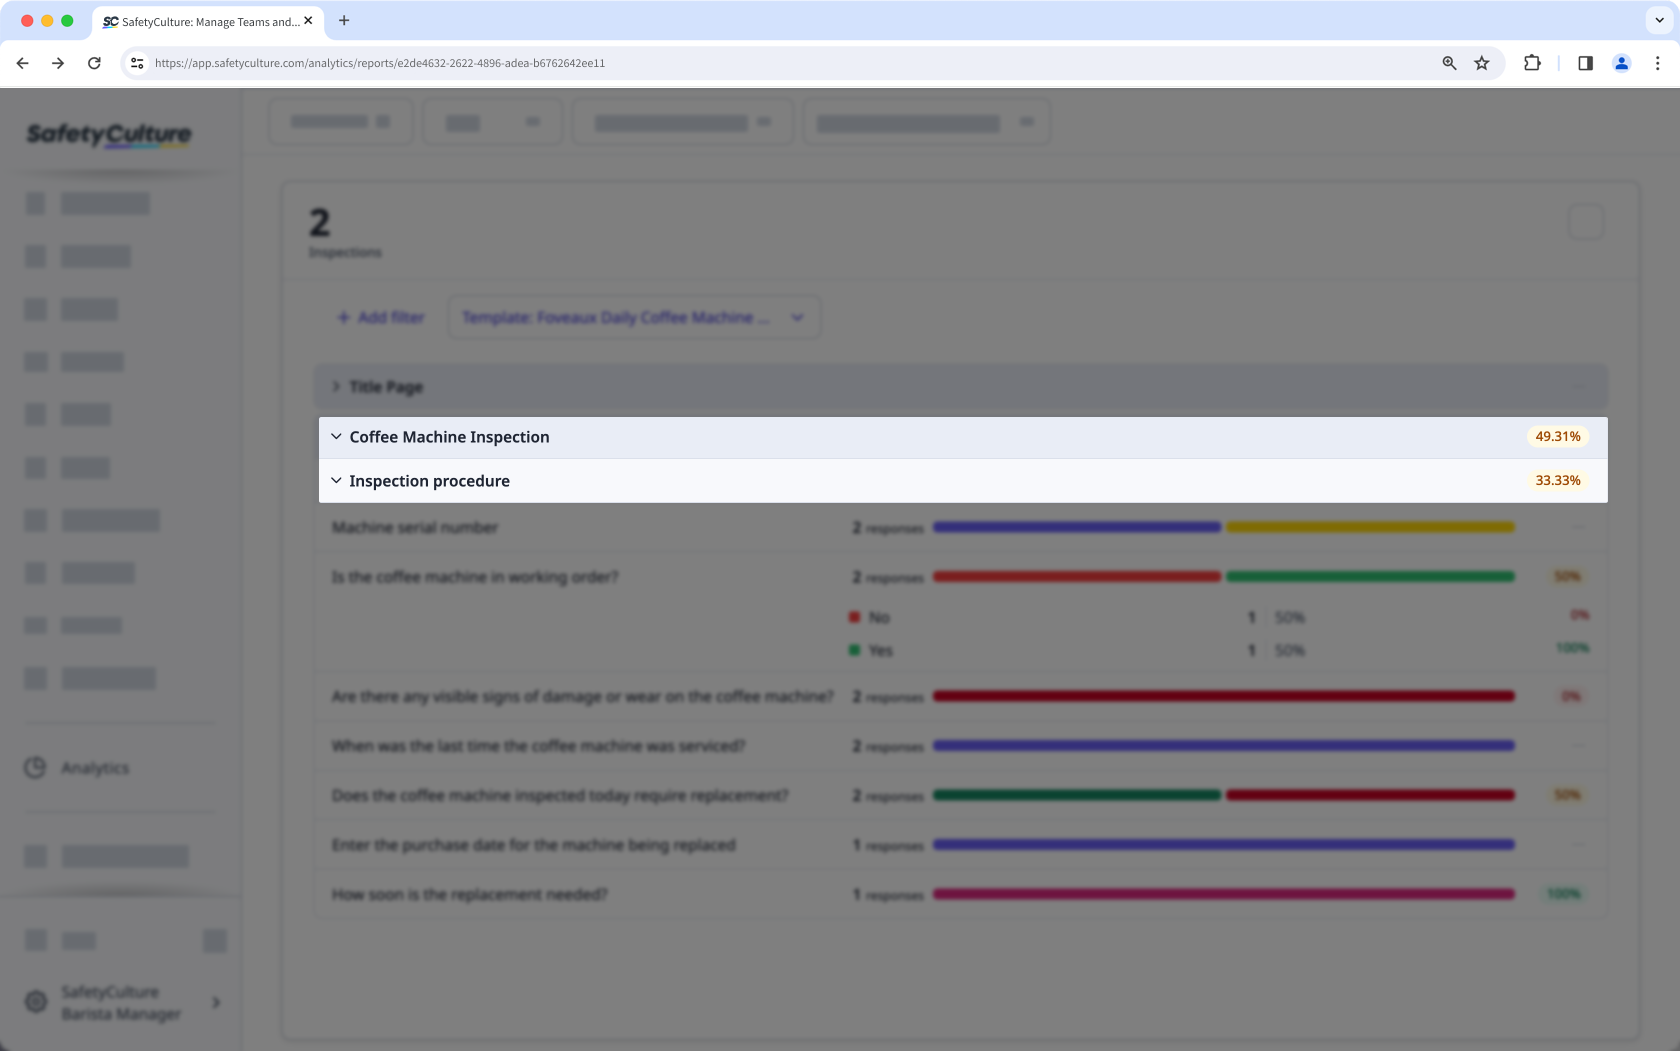
Seiten und Abschnitte
Die Durchschnittsbewertungen pro Seite und Abschnitt werden aus den entsprechenden Bewertungen in den Inspektionsberichten abgeleitet und durch die Anzahl der Inspektionen geteilt.
Wenn Sie beispielsweise zwei Inspektionen haben, bei denen die Seite „Inspektionsverfahren“ Bewertungen von 11,11 % und 87,5 % aufweist, beträgt die durchschnittliche Bewertung für diese Seite 49,31 %.
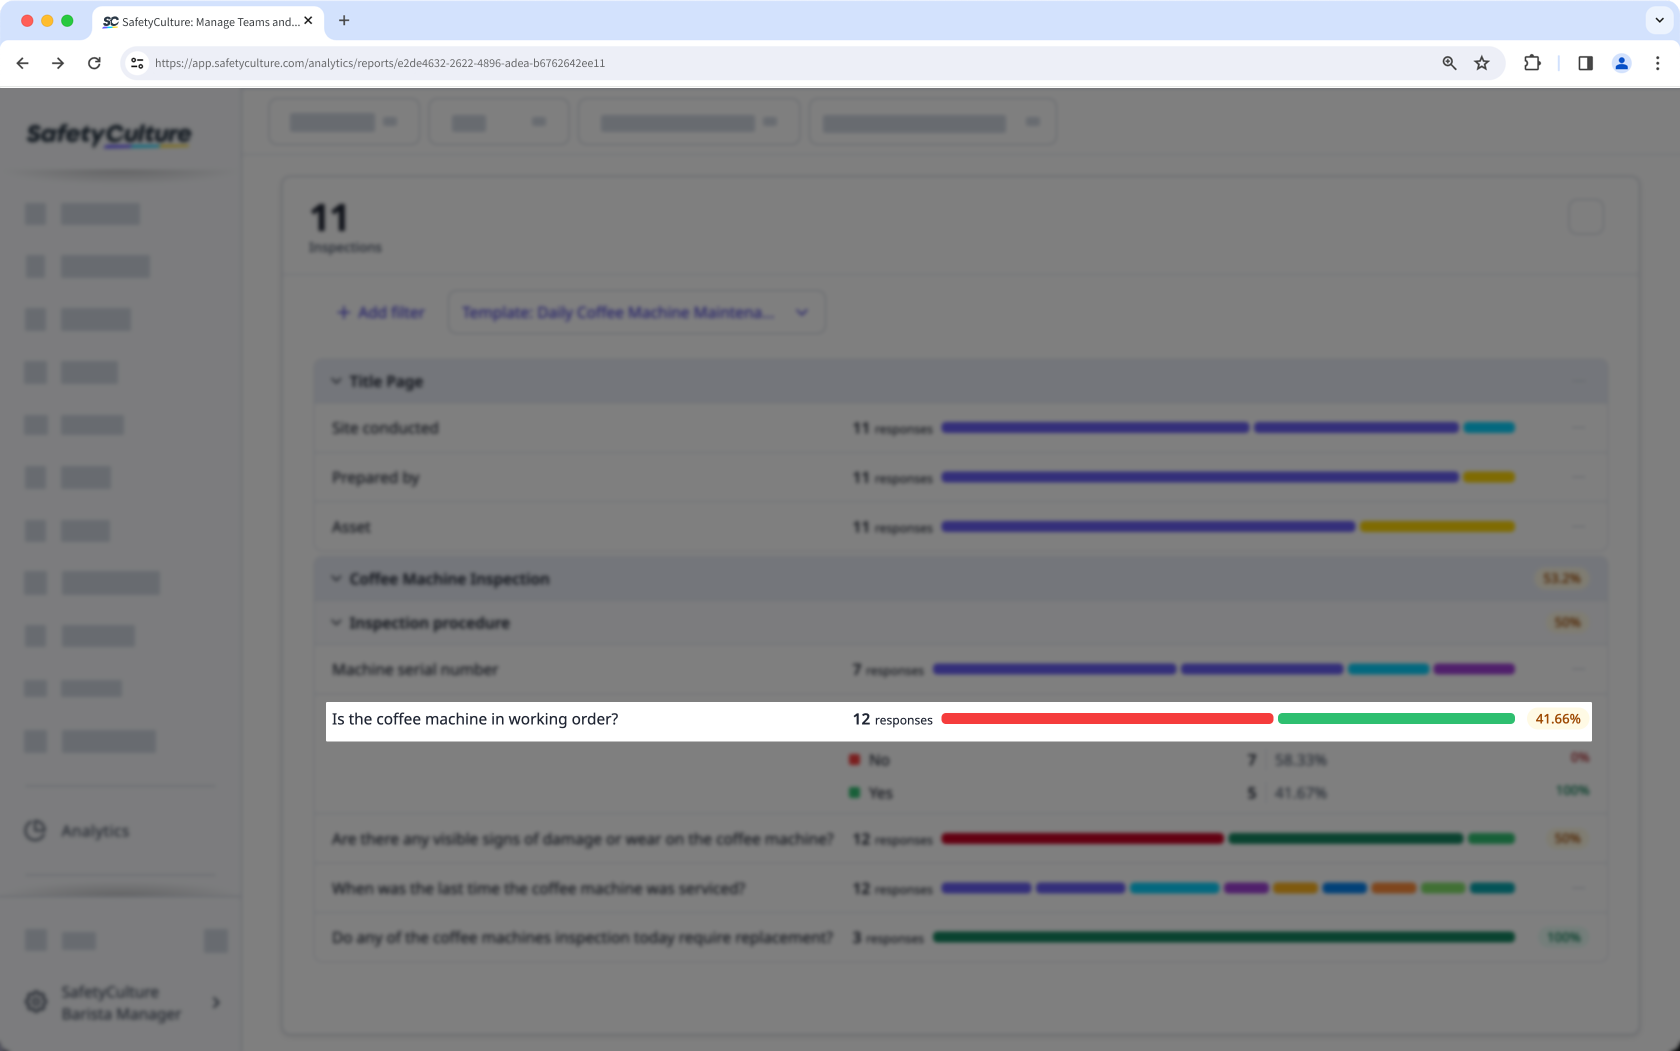
Durchschnittliche Bewertung von Fragen
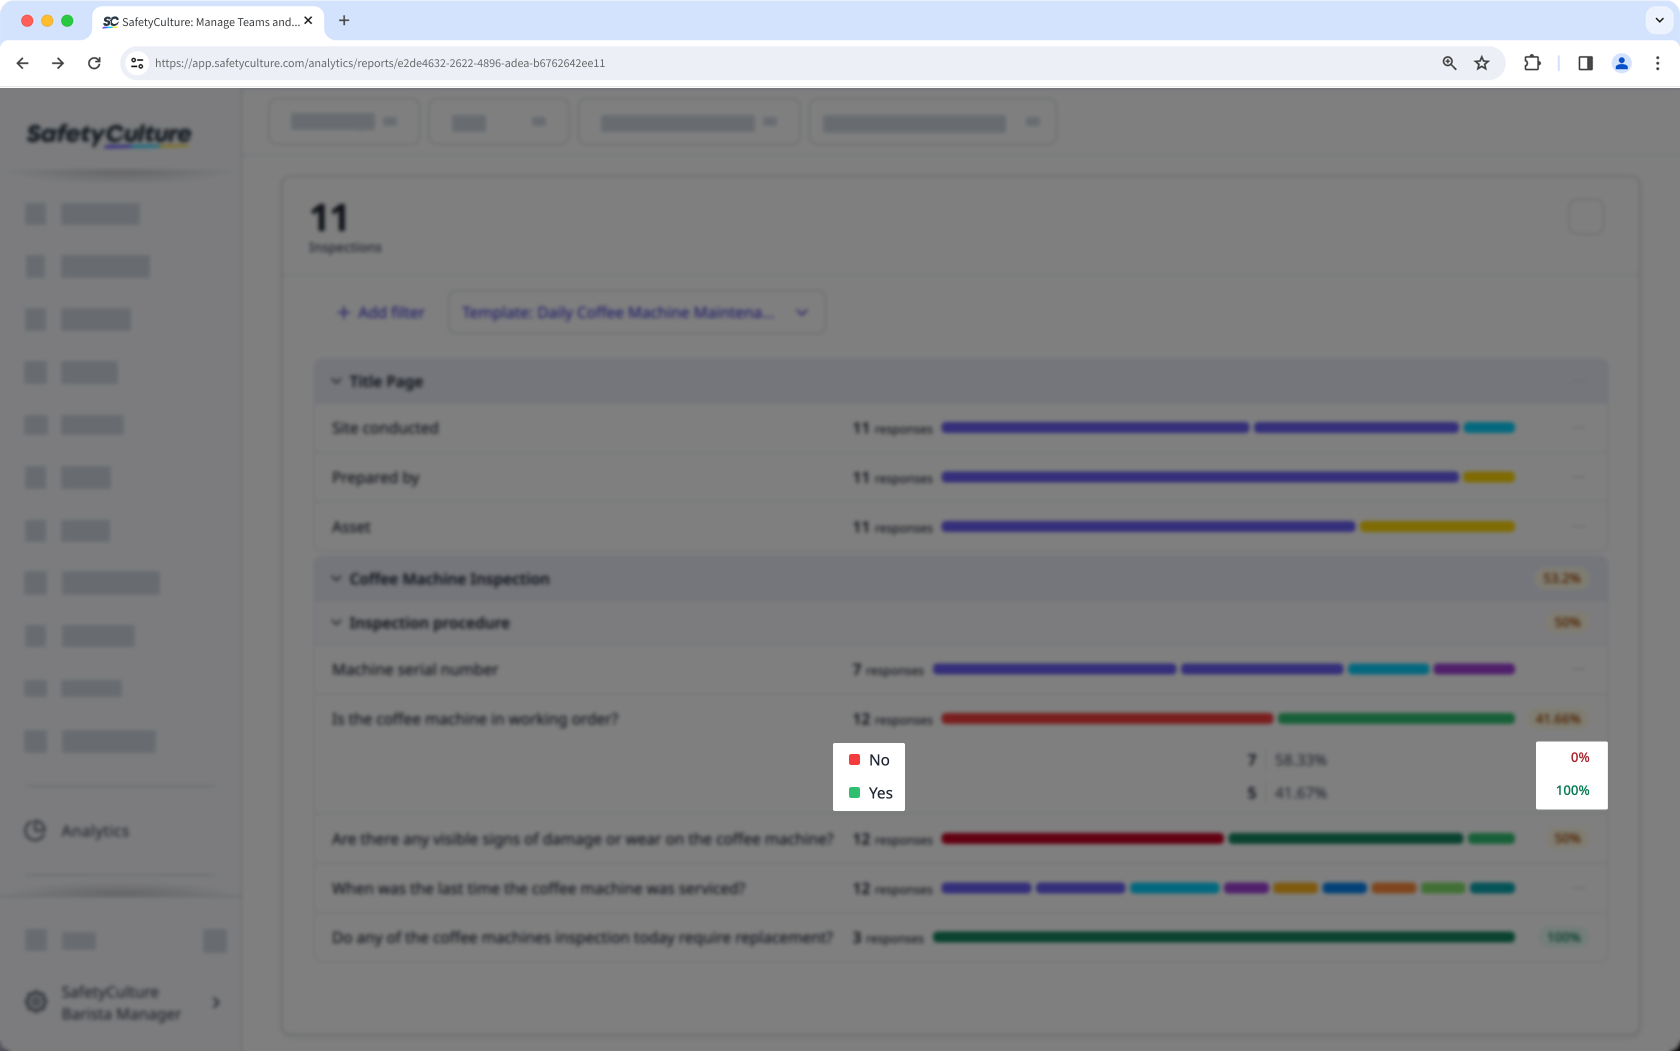
Die durchschnittliche Bewertung der Fragen wird berechnet, indem alle Bewertungsprozentsätze der Fragen addiert und anschließend durch die Anzahl der Antworten geteilt werden. Zum Beispiel: Wenn eine Frage 12 Antworten erhält, davon 7 mit 0 % und 5 mit 100 %, berechnet sich die durchschnittliche Fragen-Bewertung wie folgt:
[(7*0)+(5*100)]/12 = 41.66%
Antwort-Bewertung
Die Bewertung der Antworten basiert auf dem Bewertungs-Prozentsatz jeder Antwort in Inspektionen. Zum Beispiel: Wenn eine Frage eine maximale Bewertung von 1 hat, wobei die Antwort "Ja" gleich 1 und "Nein" gleich 0 ist, werden deren Antwort-EBewertung entsprechend als 100 % bzw. 0 % angezeigt.
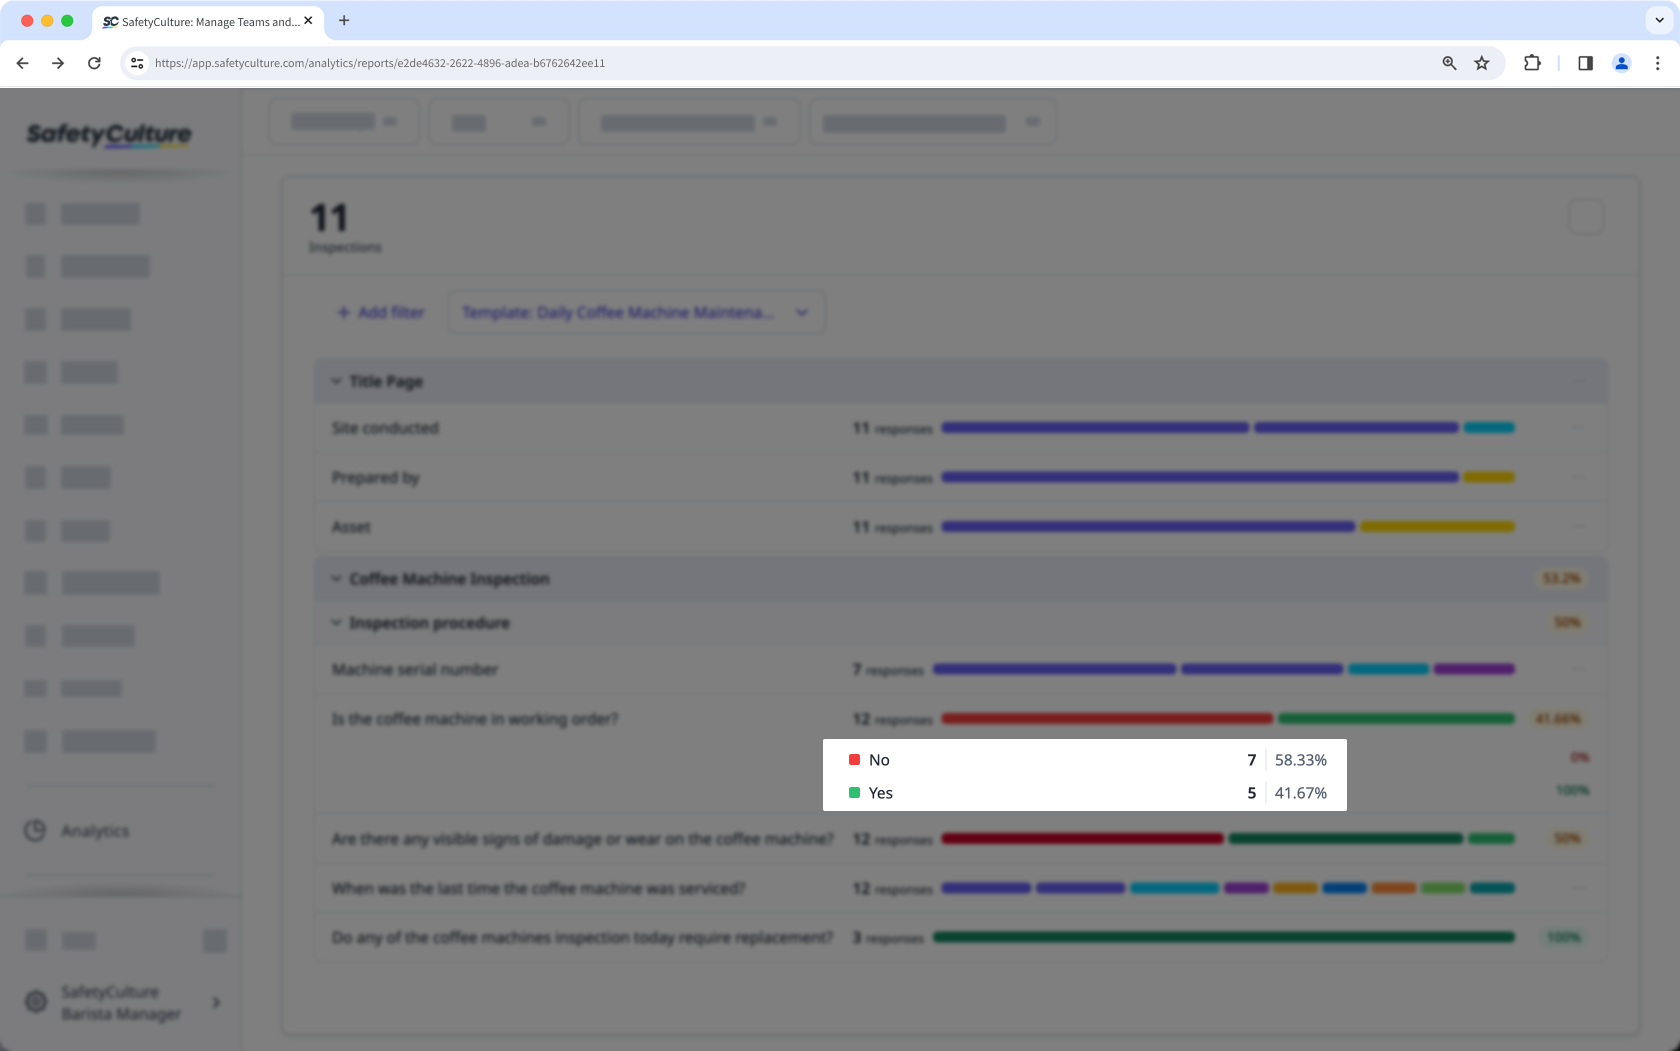
Nutzungsprozentsatz und Gesamtnutzung
Der Nutzungsprozentsatz errechnet sich aus der Anzahl der ausgewählten Antworten geteilt durch die Anzahl der Gesamtantworten. Wenn beispielsweise die Antwort "Nein" 7 von 12 Mal verwendet wurde, ergibt sich ein Nutzungsprozentsatz von 58,33 %.
Andererseits zeigt die Gesamtnutzung die Anzahl der Fälle, in denen eine Antwort in Inspektionen ausgewählt oder eingegeben wurde.