What does it mean to track inspection responses in Analytics?
The "Responses table" chart type provides a detailed view of how questions are answered for each template's inspections, offering valuable insights into inspection trends. By tracking inspection responses, you can see how many times each response has been selected for every question, helping you identify patterns and common findings across multiple inspections.
Additionally, inspection breakdowns allow you to list individual inspections based on specific responses to view your team's performance across pages, sections, and questions, making it easier to analyze data, track recurring issues, and improve decision-making.
What you'll need
To get the most out of your data, we recommend setting up scoring for your questions and custom response sets.
Track inspection responses
Select Analytics in the sidebar or select it in More.
In the chart builder, configure the chart as follows:
Data type: Select Inspections from the upper-right of the page.
Metric: Select Inspections from the dropdown.
Chart type: Select
 Responses table from the dropdown.
Template: Click Select a template and select the template you want to view a response breakdown for.
Click Save chart on the upper-right of the page.
Click Save on the upper-right of the page to save the changes to your dashboard.
You can filter by specific or flagged responses to further narrow down your inspections and gain deeper insights.
Supported response types and chart configurations
Response types
Person
Multiple choice response sets (custom and Global Response Sets)
Text answer
Number
Slider
Checkbox
Metrics
Inspections
Average duration
Average score
Flagged responses
Flagged rate
Inspection completion rate
Chart filters
Status
Template
Asset
Please note that metrics will only apply to the value on the top-left of the chart, not the actual content of the Reponses table.
How are the percentages in response tables calculated?
Pages and sections
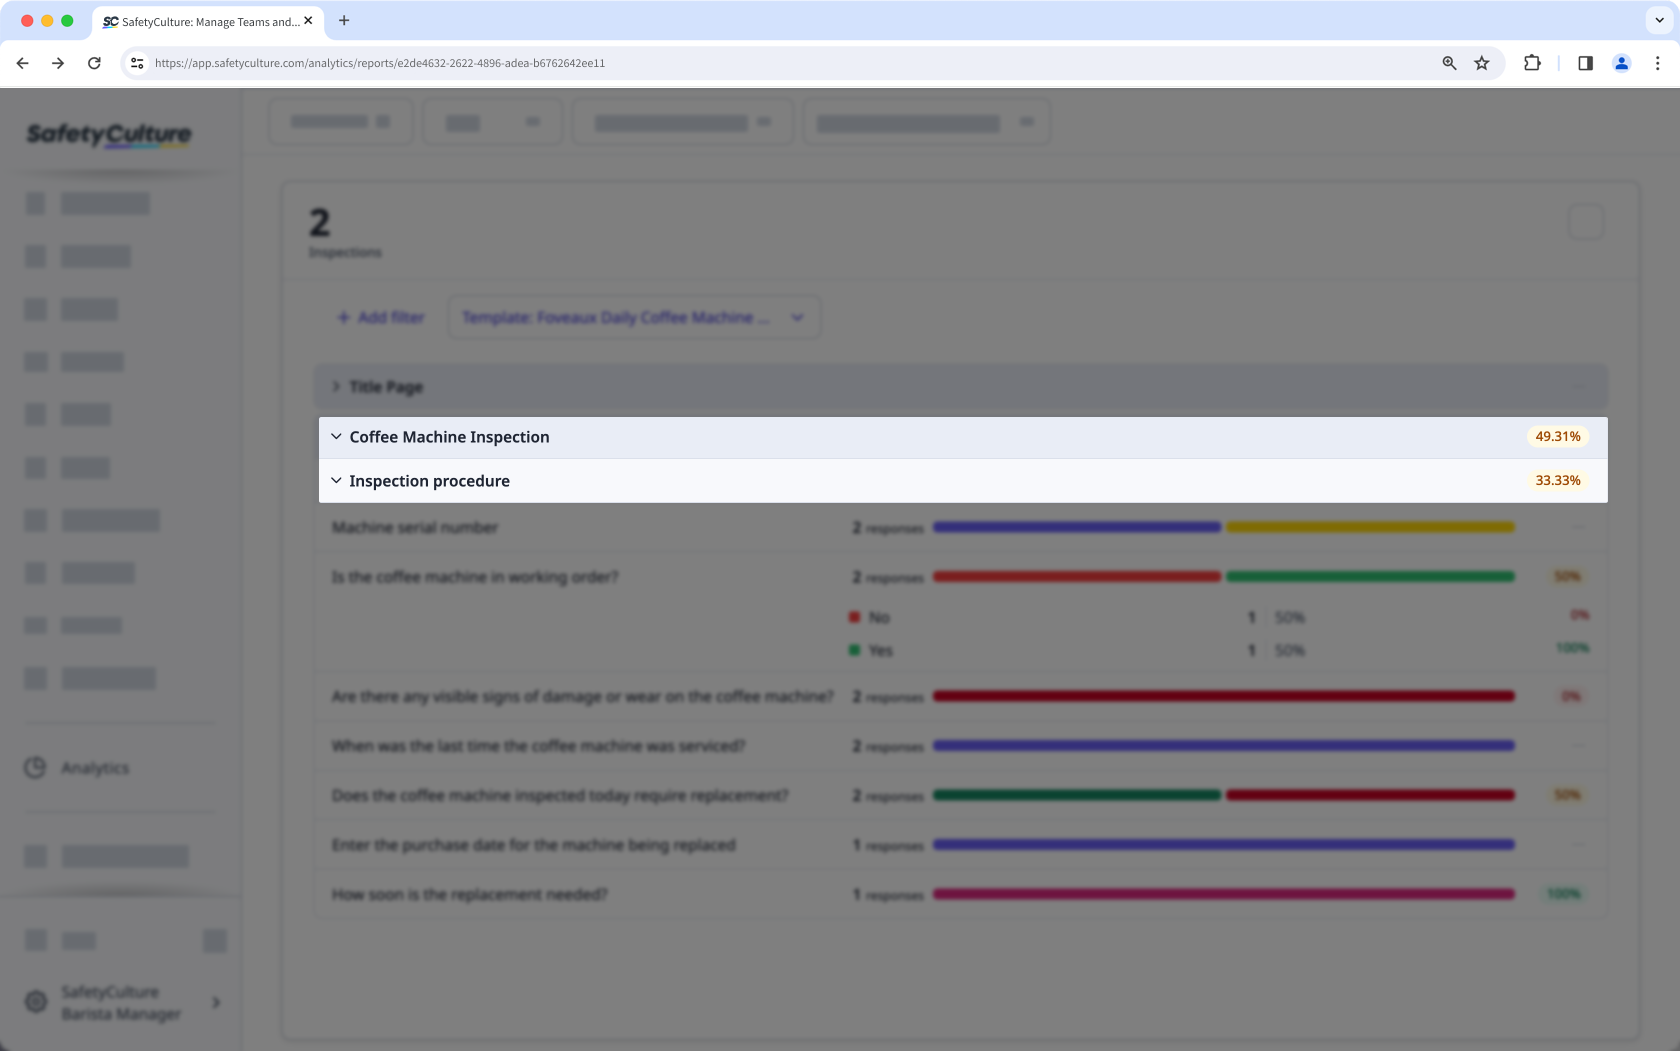
Average scores per page and section are pulled from the respective scores in the inspection reports, divided by the number of inspections.
For example, if you have 2 inspections where the "Inspection procedure" page has scores of 11.11% and 87.5% respectively, then the average score for that page is equal to 49.31%.
Average question score
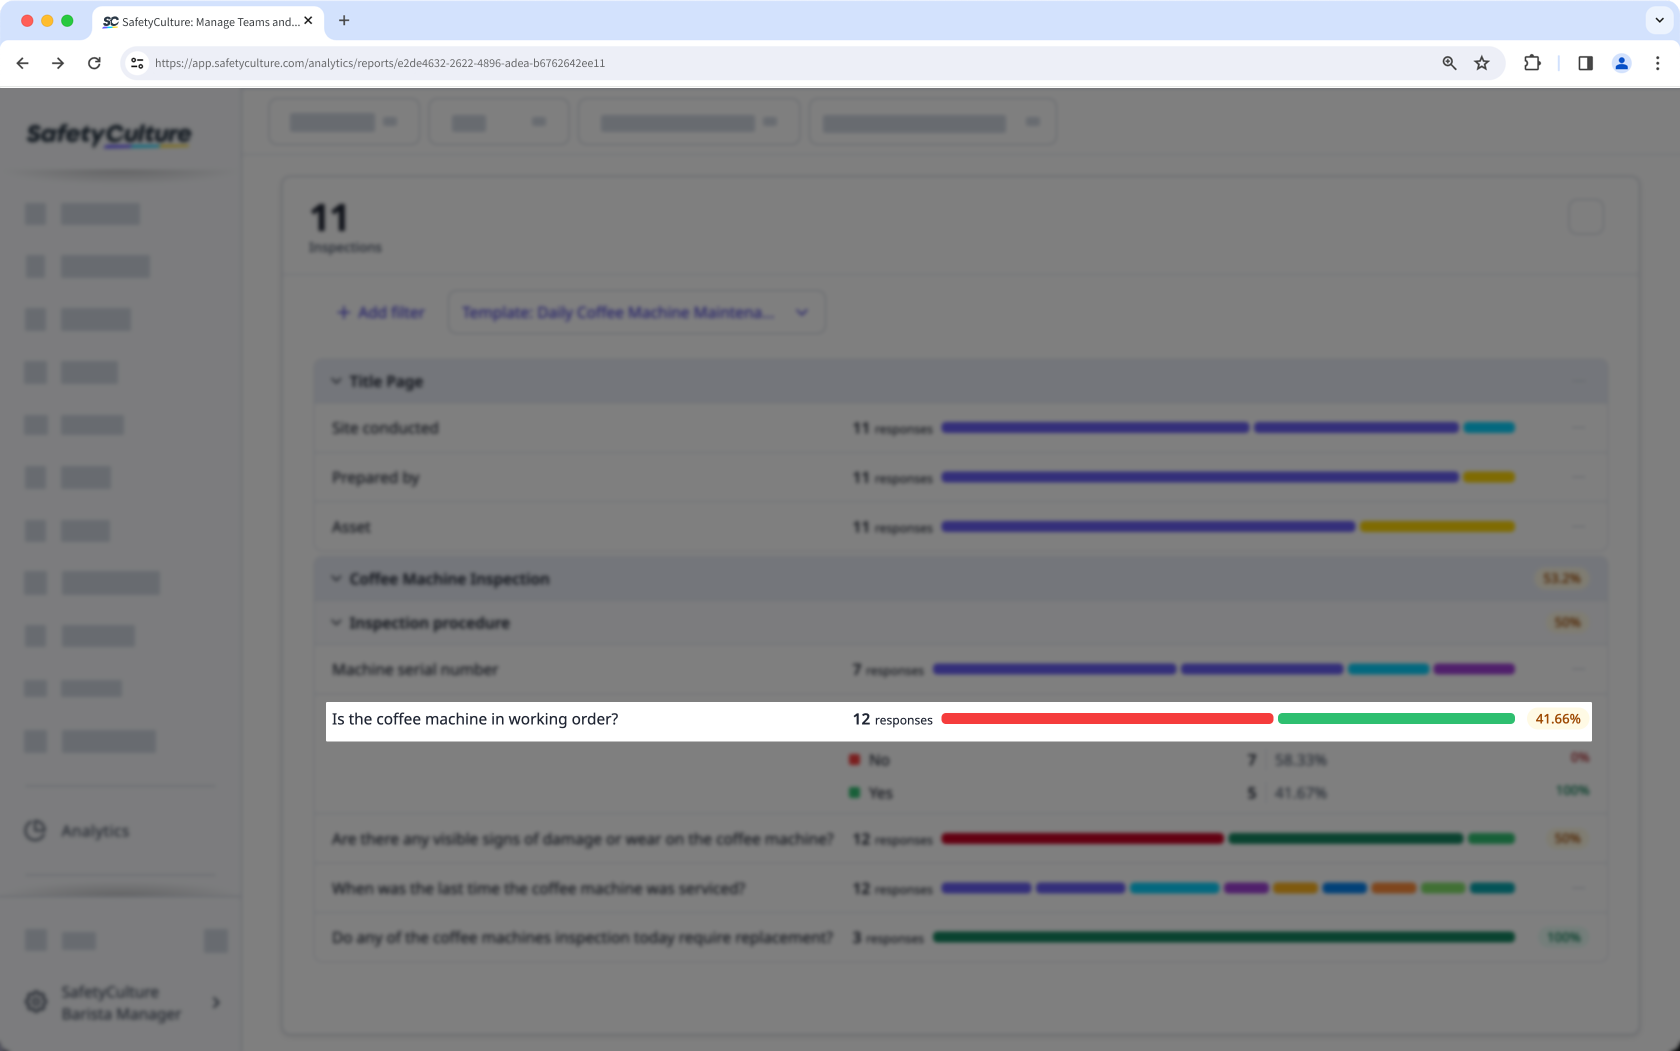
The average question score is calculated by adding all the response score percentages and then dividing by the number of responses. For example, if a question received 12 responses where 7 scored 0%, and 5 scored 100%, the average question score is calculated like this:
[(7*0)+(5*100)]/12 = 41.66%
Response score
The response score is based on each response’s score percentage in inspections. For example, if a question has a max score of 1, while the response "Yes" is equal to 1 and "No" is equal to 0, then their response scores will show as 100% and 0% respectively.
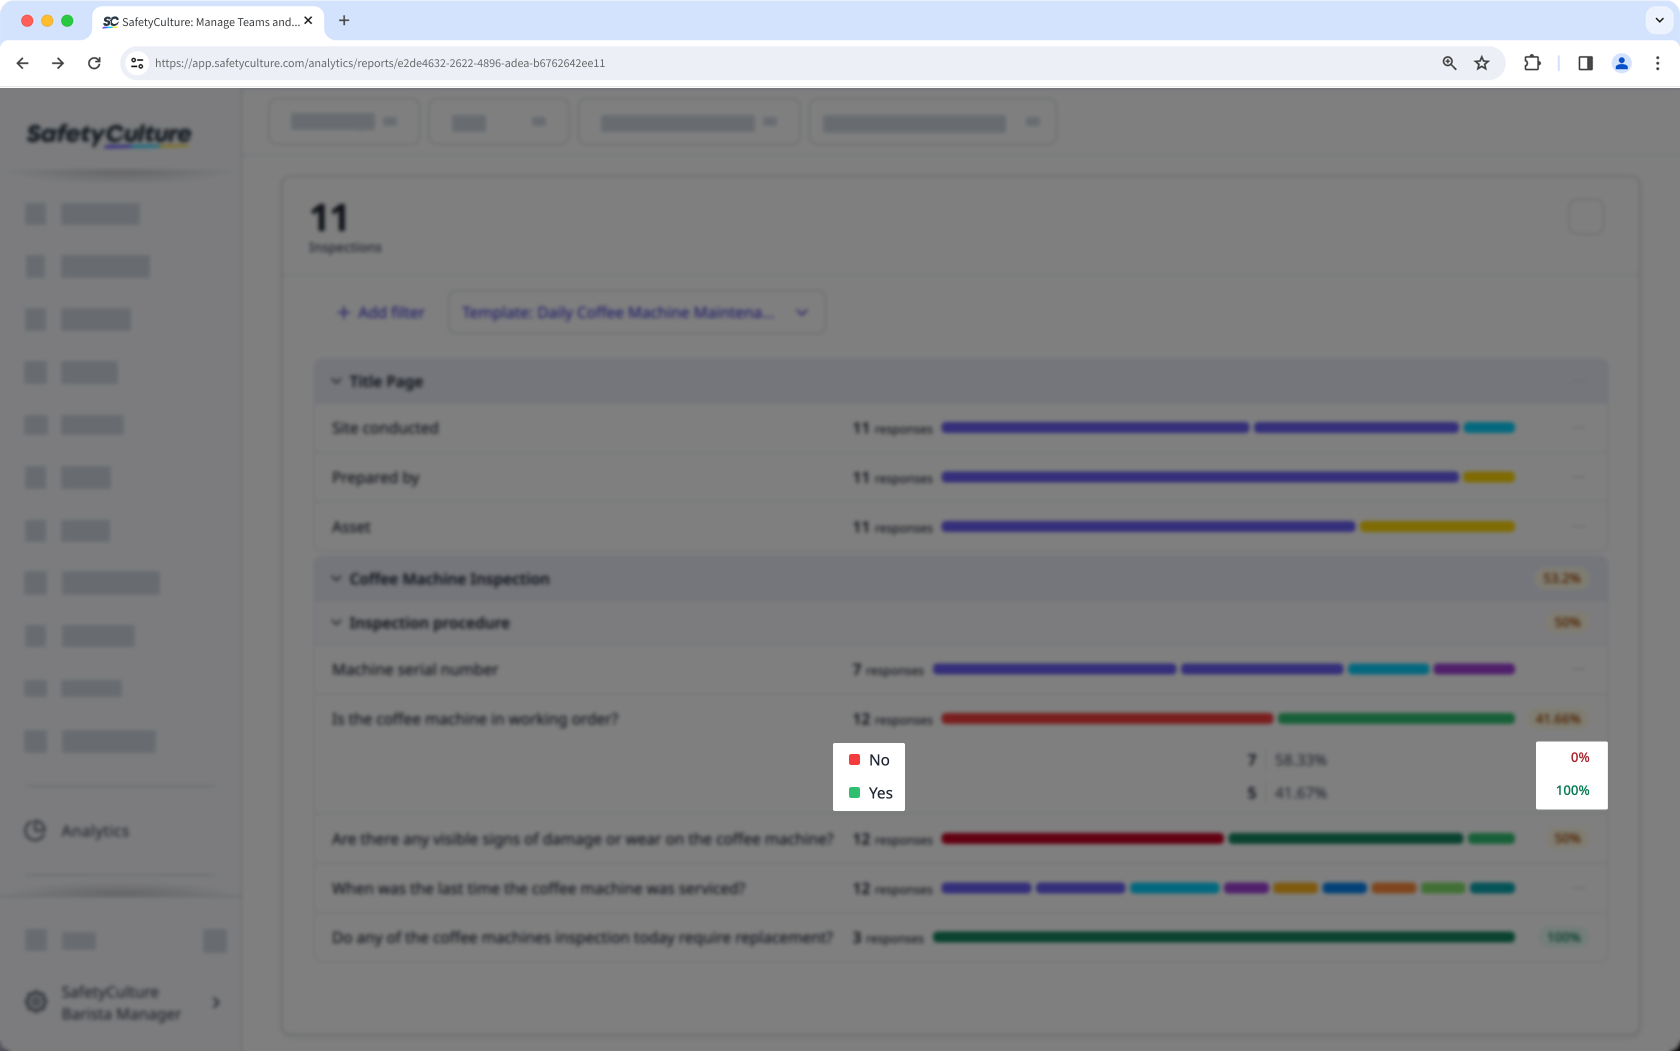
Usage percentage and usage total
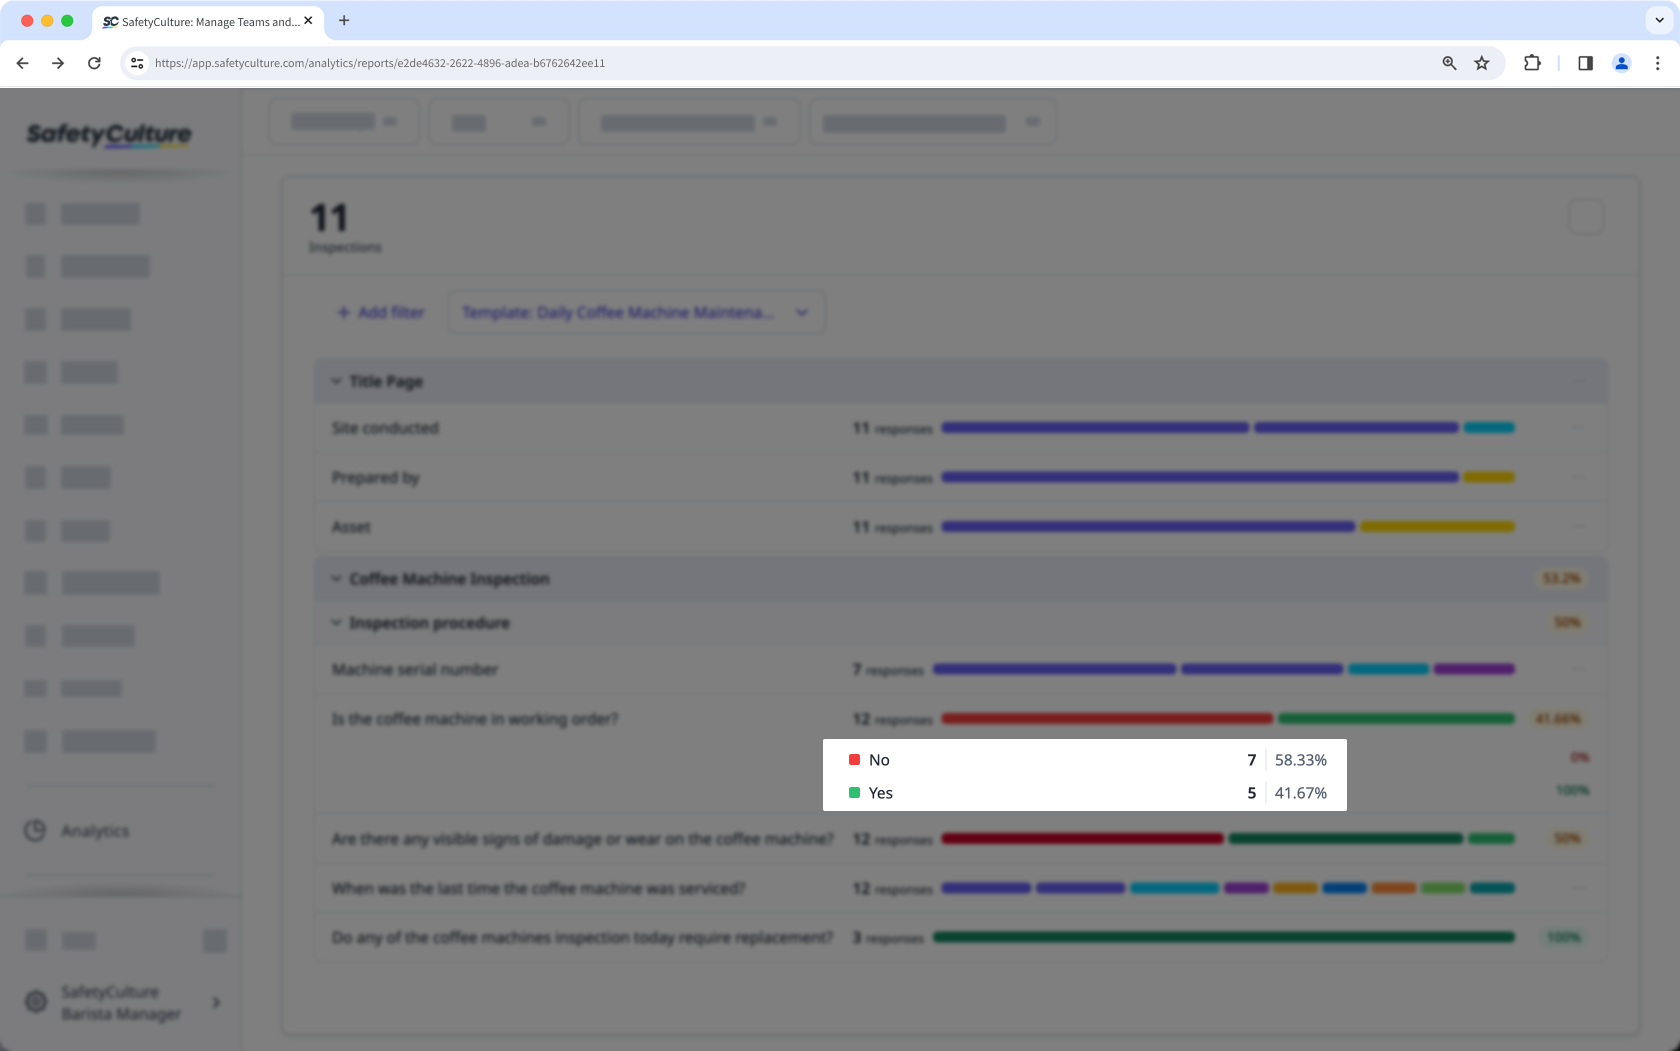
The usage percentage is calculated by the number of times a response has been selected divided by the number of total responses. For example, if the response "No" has been used 7 out of 12 times, it will have a usage percentage of 58.33%.
On the other hand, the usage total shows the number of times where a response has been selected or entered in inspections.