What does it mean to view inspections by questions and responses in Analytics?
Viewing your inspections by questions and responses allows you to understand how often each answer appears across inspections. This helps you quickly see patterns, identify recurring issues, and understand where improvements are needed most. Teams often use this to track common non-compliances, measure performance, or monitor progress over time. It fits into your broader reporting and improvement process by turning inspection data into clear insights that support smarter, faster decisions.
What you'll need
View inspections by a question
Select Analytics in the sidebar or select it in More.
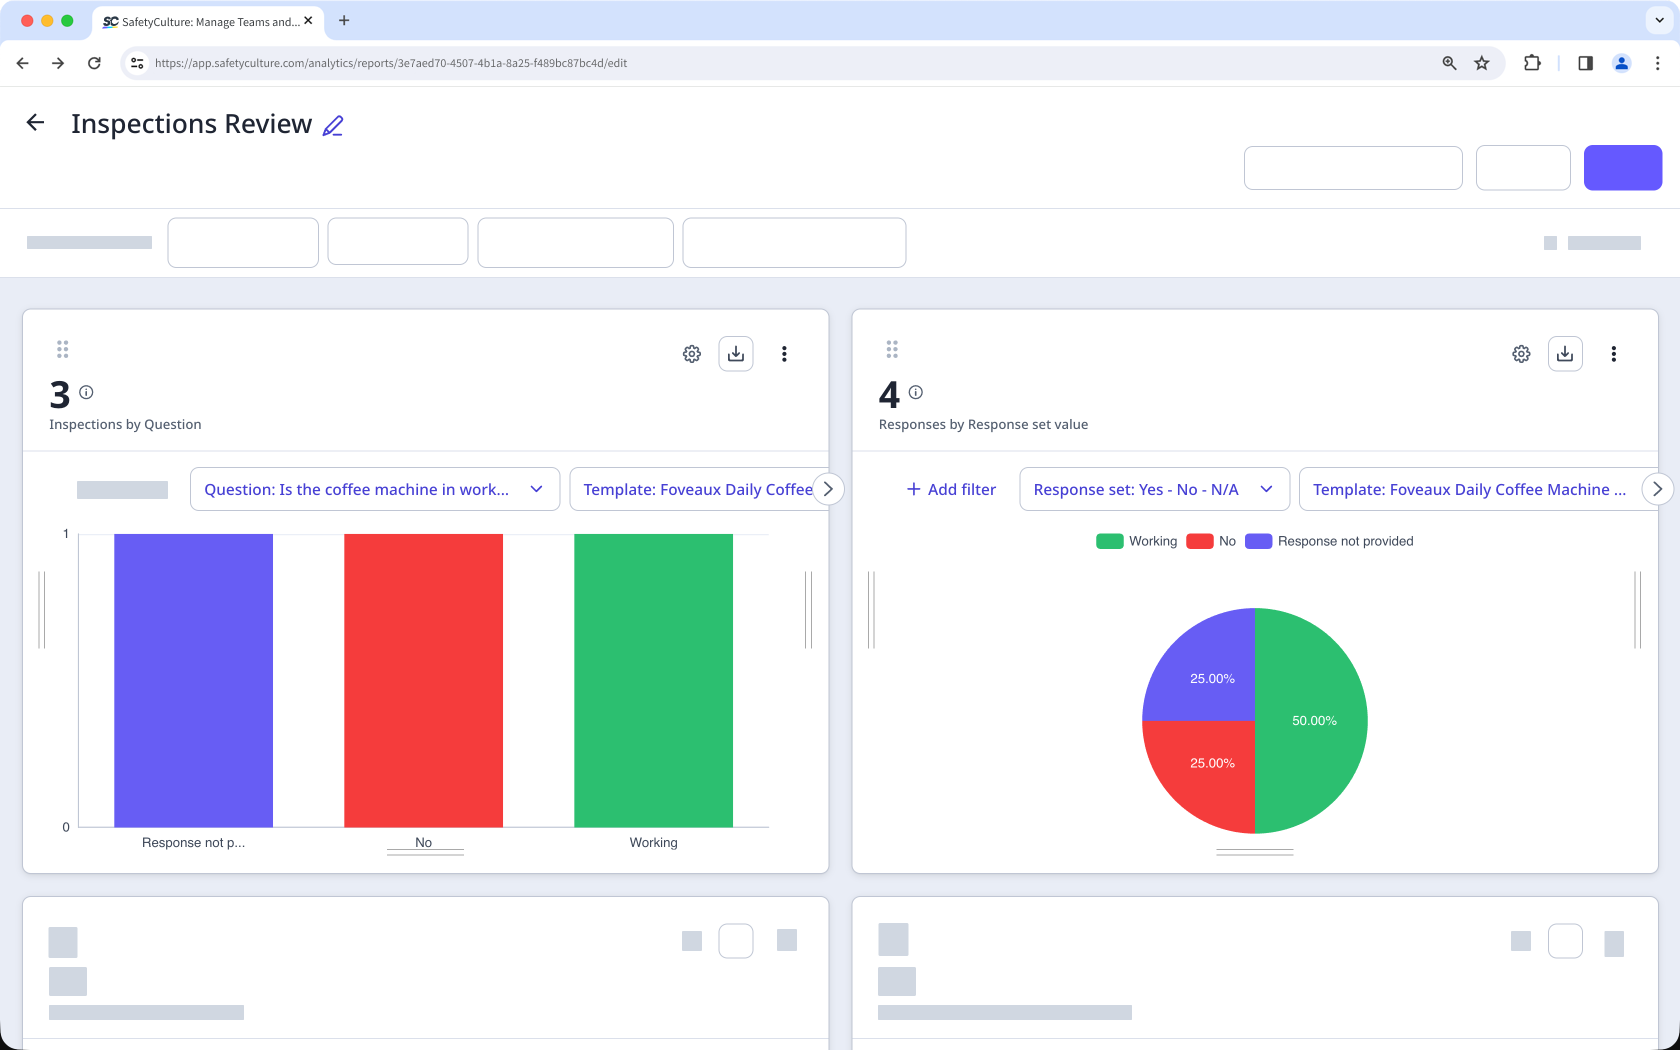
In the chart builder, configure the chart as follows:
Data type: Select Inspections from the upper-right of the page.
Metric: Select Inspections from the dropdown.
Attribute: Select Question from the dropdown.
Click Select a question, then select the template and the question you want to analyze from the dropdown menu.
Click Done.
Click Save chart on the upper-right of the page.
On your dashboard, click Save on the upper-right of the page to save your changes.
The total chart count reflects the number of responses for the selected question. For example, if a user selects "Yes," "No," and "N/A" for the same question, each response will be counted, resulting in a total of 3.
View inspections by a response set
Select Analytics in the sidebar or select it in More.
In the chart builder, configure the chart as follows:
Data type: Select Inspections from the upper-right of the page.
Metric: Select Responses from the dropdown.
Attribute: Response set value is set as the default.
Click Select a response set and select the response set you want to use.
Click Save chart on the upper-right of the page to save the changes to the chart.
Click Save on the upper-right of the page to save the changes to your dashboard.
If you've edited a default response set and want to use it to view your inspection data, we suggest filtering with a specific template to ensure you get the correct data.
You can also use the "Question and response" filter to further narrow down your data.
Limitations
You can only filter data by selecting default response sets and Global Response Sets. Default response sets are added automatically when you create a new template. However, when you rename, delete, or add new responses, they will appear as number placeholders in charts.
The "Question" attribute only supports multiple-choice questions which include custom response sets and Global Response Sets.
Charts with multiple metrics selected can’t use the “Question” attribute.