Was bedeutet es, Inspektionen nach Fragen und Antworten in den Analysen anzeigen?
Wenn Sie Ihre Inspektionen nach Fragen und Antworten aufschlüsseln, können Sie nachvollziehen, wie oft jede Antwort bei den Inspektionen vorkommt. So können Sie schnell Muster erkennen, wiederkehrende Probleme identifizieren und verstehen, wo Verbesserungen am nötigsten sind. Teams nutzen dies häufig, um häufige Verstöße zu verfolgen, die Leistung zu messen oder den Fortschritt im Laufe der Zeit zu überwachen. Die Lösung fügt sich in Ihren umfassenderen Berichts- und Verbesserungsprozess ein, indem sie Inspektionsdaten in klare Erkenntnisse umwandelt, die intelligentere und schnellere Entscheidungen ermöglichen.
Was Sie brauchen
Inspektionen nach einer Frage anzeigen
Wählen Sie Analysen in der Seitenleiste oder in Mehr aus.
Fügen Sie hinzu oder bearbeiten Sie ein bestehendes Diagramm.
Konfigurieren Sie das Diagramm im Chart Builder wie folgt:
Datentyp: Wählen Sie oben rechts auf der Seite Inspektionen aus.
Metrik: Wählen Sie Inspektionen aus der Dropdown-Liste.
Attribut: Wählen Sie Frage aus der Dropdown-Liste.
Klicken Sie auf Frage auswählen und wählen Sie dann aus dem Dropdown-Menü die Vorlage und die Frage aus, die Sie analysieren möchten
Klicken Sie auf Fertig.
Klicken Sie auf Diagramm speichern oben rechts auf der Seite.
Klicken Sie in Ihrem Dashboard auf Speichern oben rechts auf der Seite, um Ihre Änderungen zu speichern.
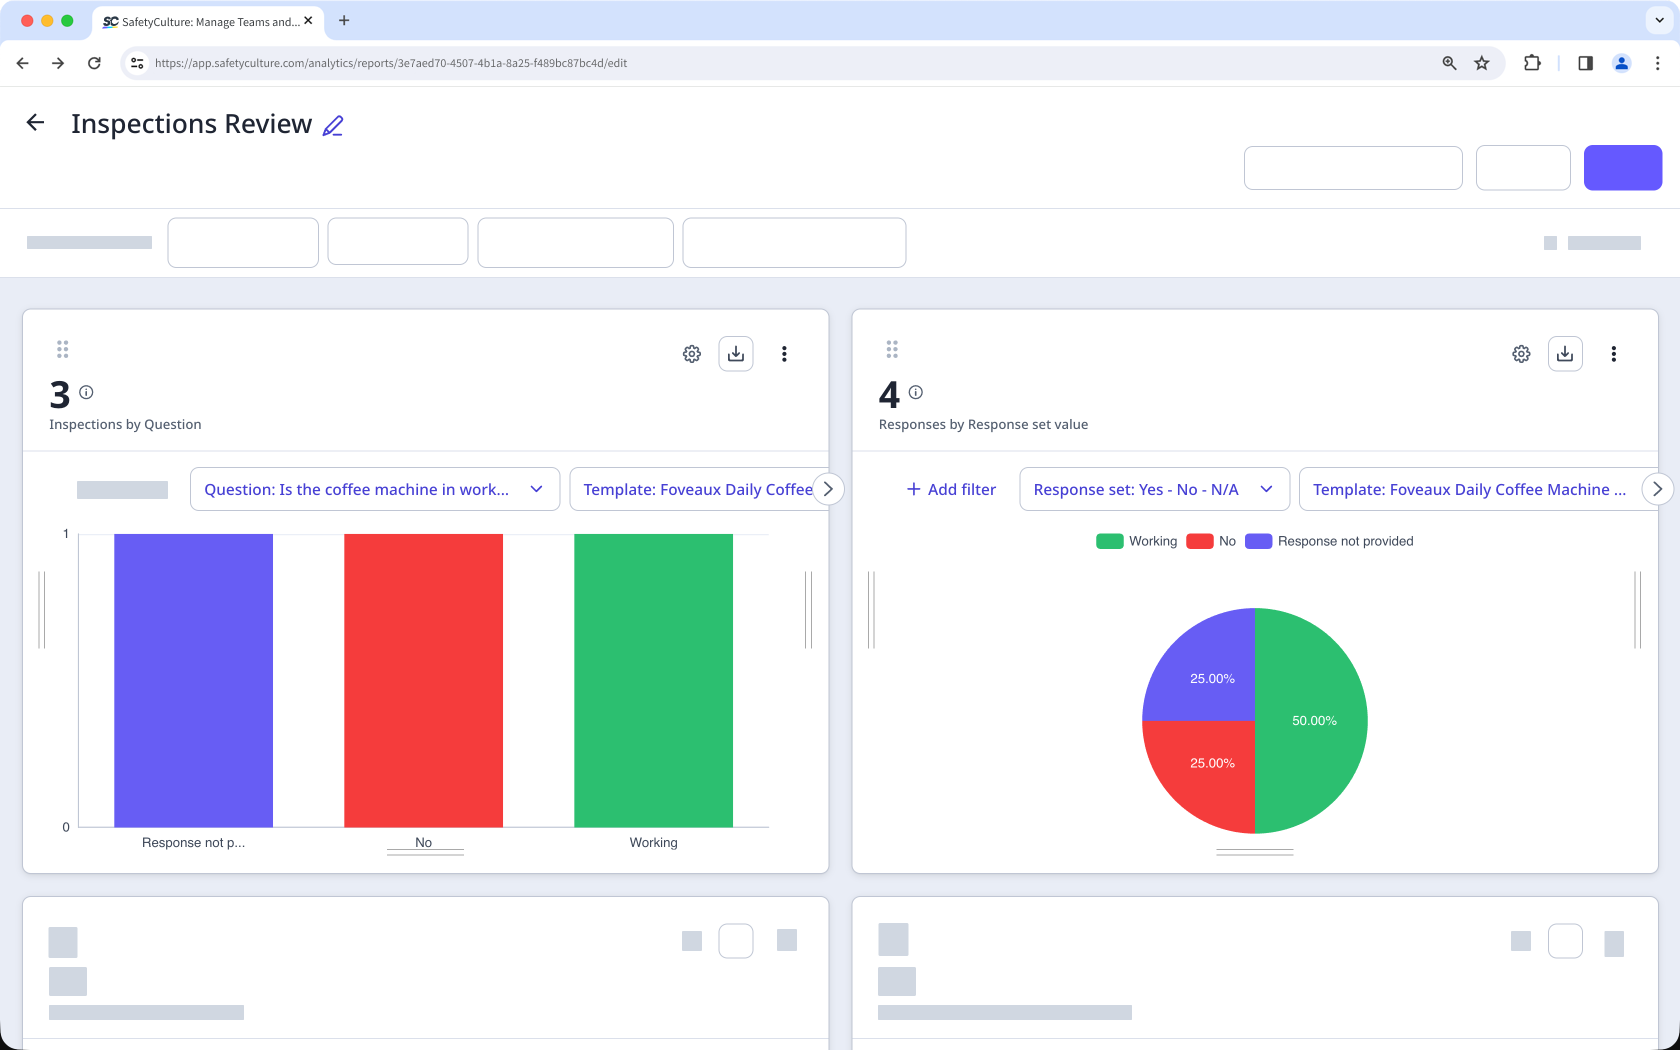
Die Gesamtzahl der Diagramme spiegelt die Anzahl der Antworten für die ausgewählte Frage wider. Wenn ein Benutzer beispielsweise "Ja", "Nein" und "Nicht zutreffend" für dieselbe Frage auswählt, wird jede Antwort gezählt, so dass sich eine Gesamtzahl von 3 ergibt.
Inspektionen nach einem Antwort-Set anzeigen
Wählen Sie Analysen in der Seitenleiste oder in Mehr aus.
Fügen Sie hinzu oder bearbeiten Sie ein bestehendes Diagramm.
Konfigurieren Sie im Diagrammersteller das Diagramm folgendermaßen:
Datentyp: Wählen Sie oben rechts auf der Seite Inspektionen aus.
Metrik: Wählen Sie Antworten aus der Dropdown-Liste.
Attribut: Werte für Antwort-Sets ist als Standard festgelegt.
Klicken Sie auf Antwort-Set auswählen und wählen Sie das Antwort-Set, das Sie verwenden möchten.
Klicken Sie oben rechts auf der Seite auf Diagramm speichern, um die Änderungen im Diagramm zu speichern.
Klicken Sie oben rechts auf der Seite auf Speichern, um die Änderungen in Ihrem Dashboard zu speichern.
Wenn Sie einen Standardbeantwortungssatz bearbeitet haben und diesen für die Anzeige Ihrer Inspektionsdaten verwenden möchten, empfehlen wir Ihnen, mit einer spezifischen Vorlage zu filtern, um sicherzustellen, dass Sie die richtigen Daten erhalten.
Sie können auch den Filter "Frage und Antwort" verwenden, um Ihre Daten weiter einzugrenzen.
Einschränkungen
Sie können Daten nur filtern, indem Sie Standard-Antwort-Sets und globale Antwort-Sets auswählen. Standard-Antwort-Sets werden automatisch hinzugefügt, wenn Sie eine neue Vorlage erstellen. Wenn Sie jedoch Antworten umbenennen, löschen oder neue hinzufügen, werden diese als Zahlenplatzhalter in Diagrammen angezeigt.
Das Attribut „Frage“ unterstützt nur Multiple-Choice-Fragen, die benutzerdefinierte Antwort-Sets und globale Antwort-Sets enthalten.
Diagramme mit mehreren ausgewählten Messwerten können das Attribut „Frage“ nicht verwenden.