What are Analytics dashboards?
Analytics dashboards allow you to create focused views of your organization's data within SafetyCulture. They keep data focused so teams and stakeholders only see what matters most to them.
By creating dashboards, you can manage the data flow across your organization so that sites or groups only see the information most relevant to them. For example, you can create a dashboard for site managers that highlights completion rates, and another for leadership that focuses on high-level trends. This helps reduce noise, protect sensitive information, and make faster, better-informed decisions.
Exploring Analytics dashboards
Dashboard types
Dashboard type | Recommended use case | Permission required to create |
|---|---|---|
Custom | Best used for creating tailored views with specific metrics and data sources relevant to the organization's unique business needs, combining multiple data types into a personalized view. | |
Site-based | Best used for monitoring location-specific metrics, comparing performance across different sites, managing site-level compliance, and facility-specific reporting. | |
Individual-based | Best used for tracking individual user performance, monitoring personal completion rates, managing individual assignments and responsibilities, and performance reviews. |
Custom
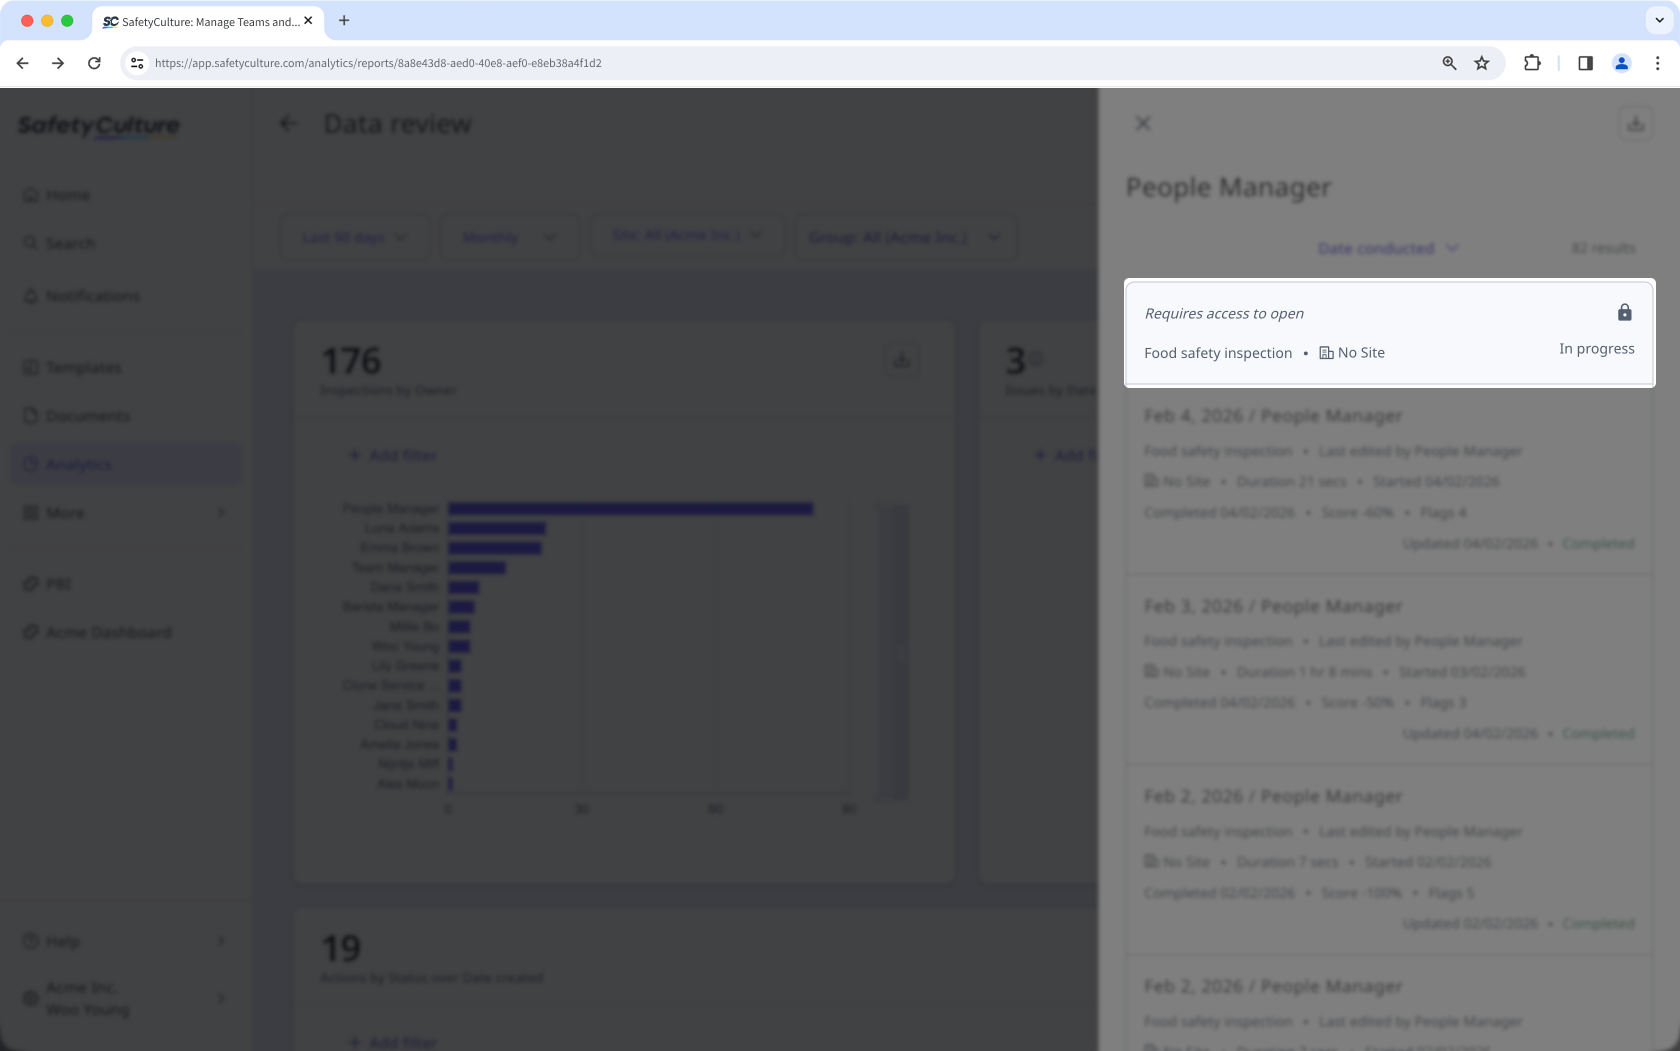
Custom dashboards are static, meaning the data is of the entire organization, and what each user sees at the dashboard level is the same. However, if a user wants to drill down into specific data, what they can see is based on their access.
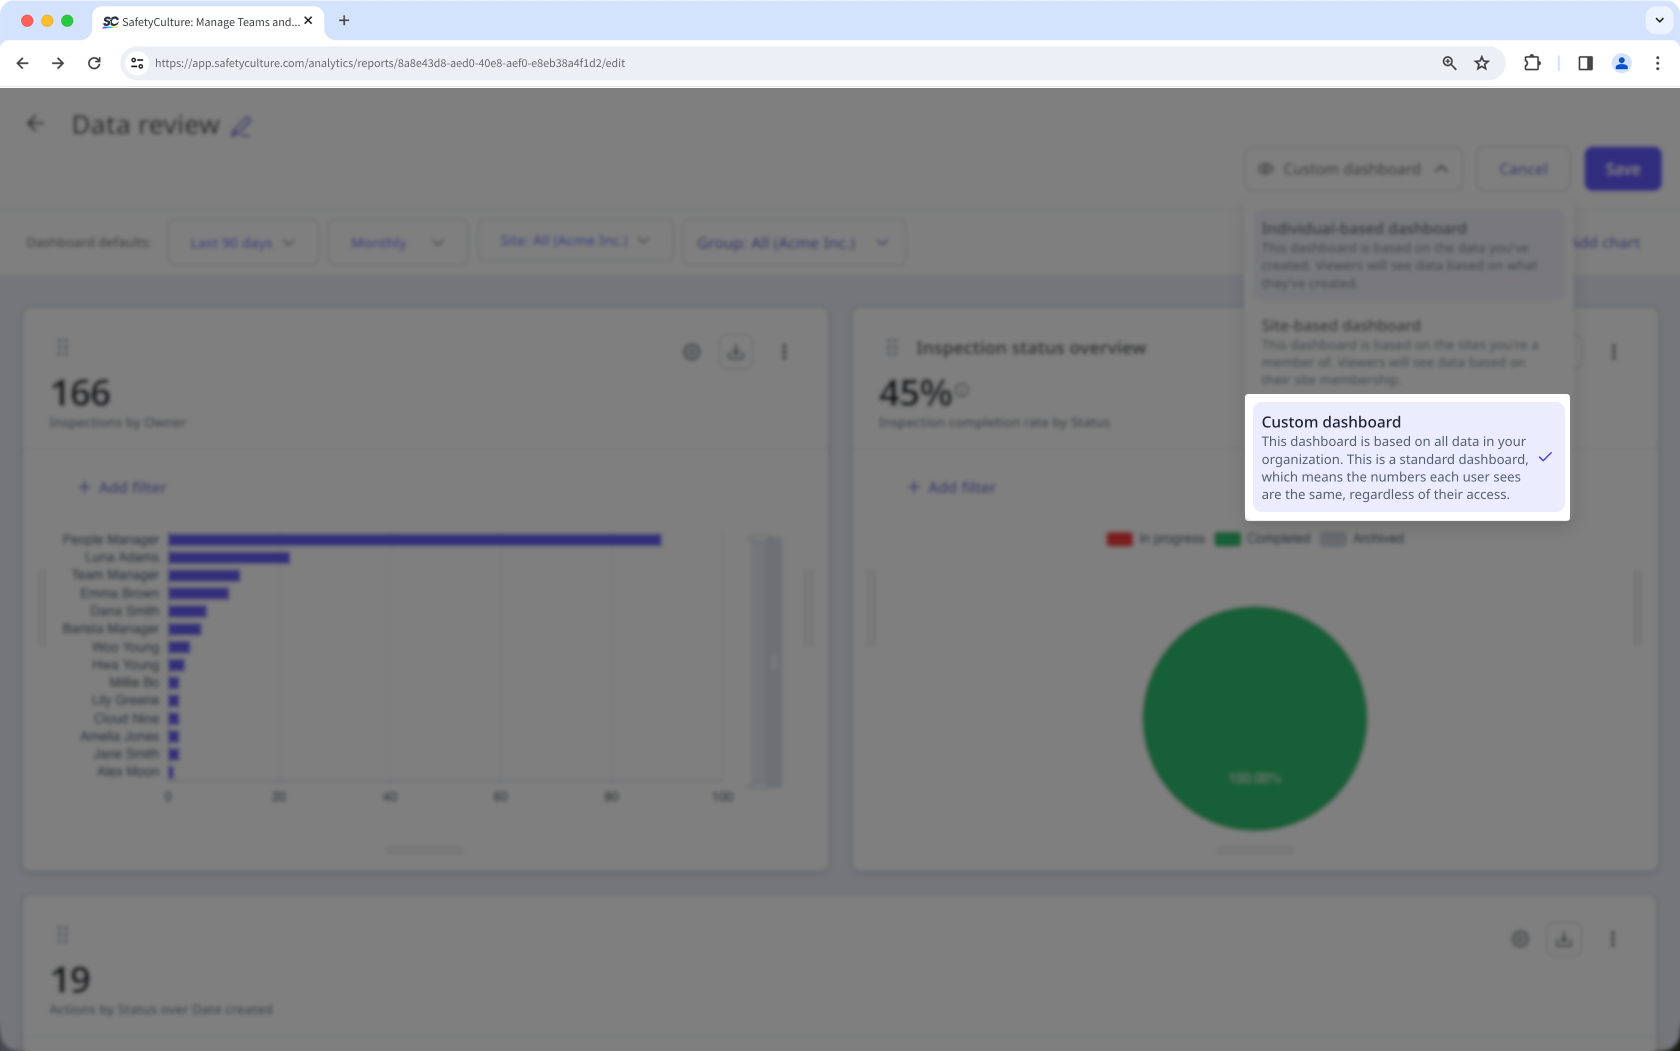
For example, if John creates a custom dashboard, the data he sees as he adds charts and applies filters are of the entire organization. When he shares the dashboard with Jane, Jane will see the same set of data. However, if John or Jane drills down into specific data, they'll only be able to see the details of what they can access.
Site-based
Site-based dashboards are dynamic, meaning the data each user sees is different, as it's based on the data associated with the sites they're a member of.
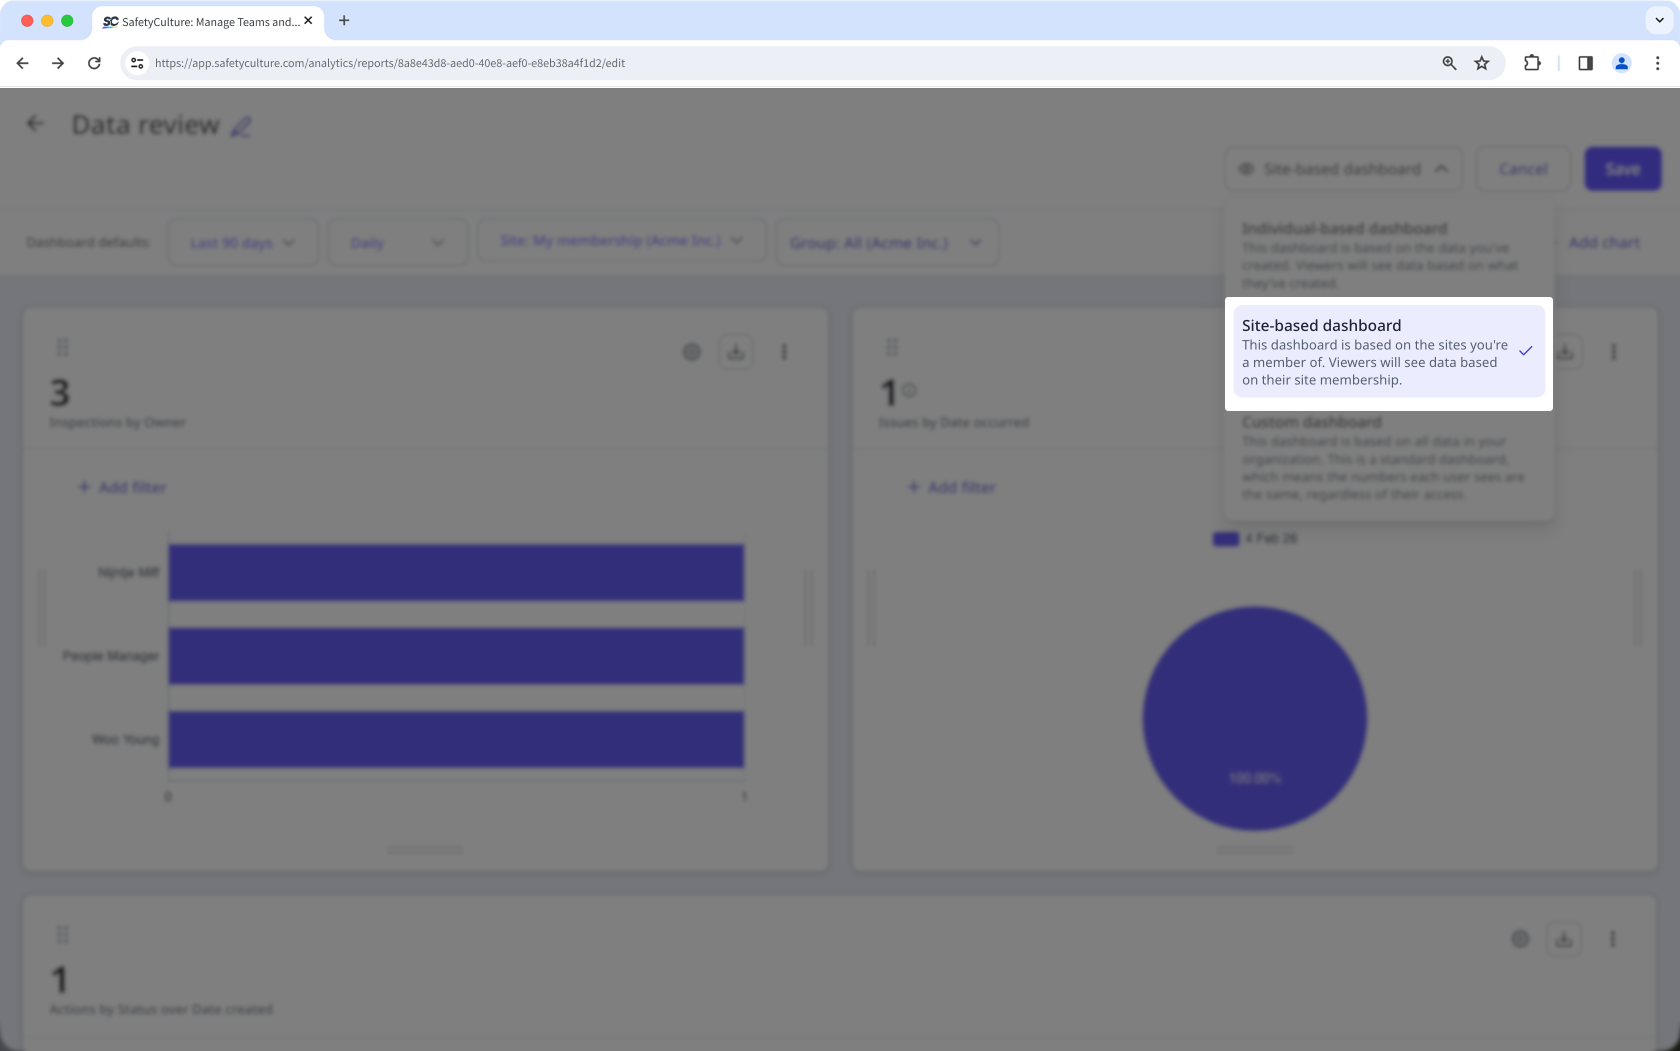
For example, if John creates a site-based dashboard, the "Site membership" filter will be turned on, and he'll only see inspections, actions, etc., associated with the sites he's a member of. When he shares the dashboard with Jane, Jane may see a different set of data based on the inspections, actions, etc., associated with the sites that she's a member of.
Individual-based
Individual-based dashboards are dynamic, meaning the data each user sees is different, as it's based on what each user has created.
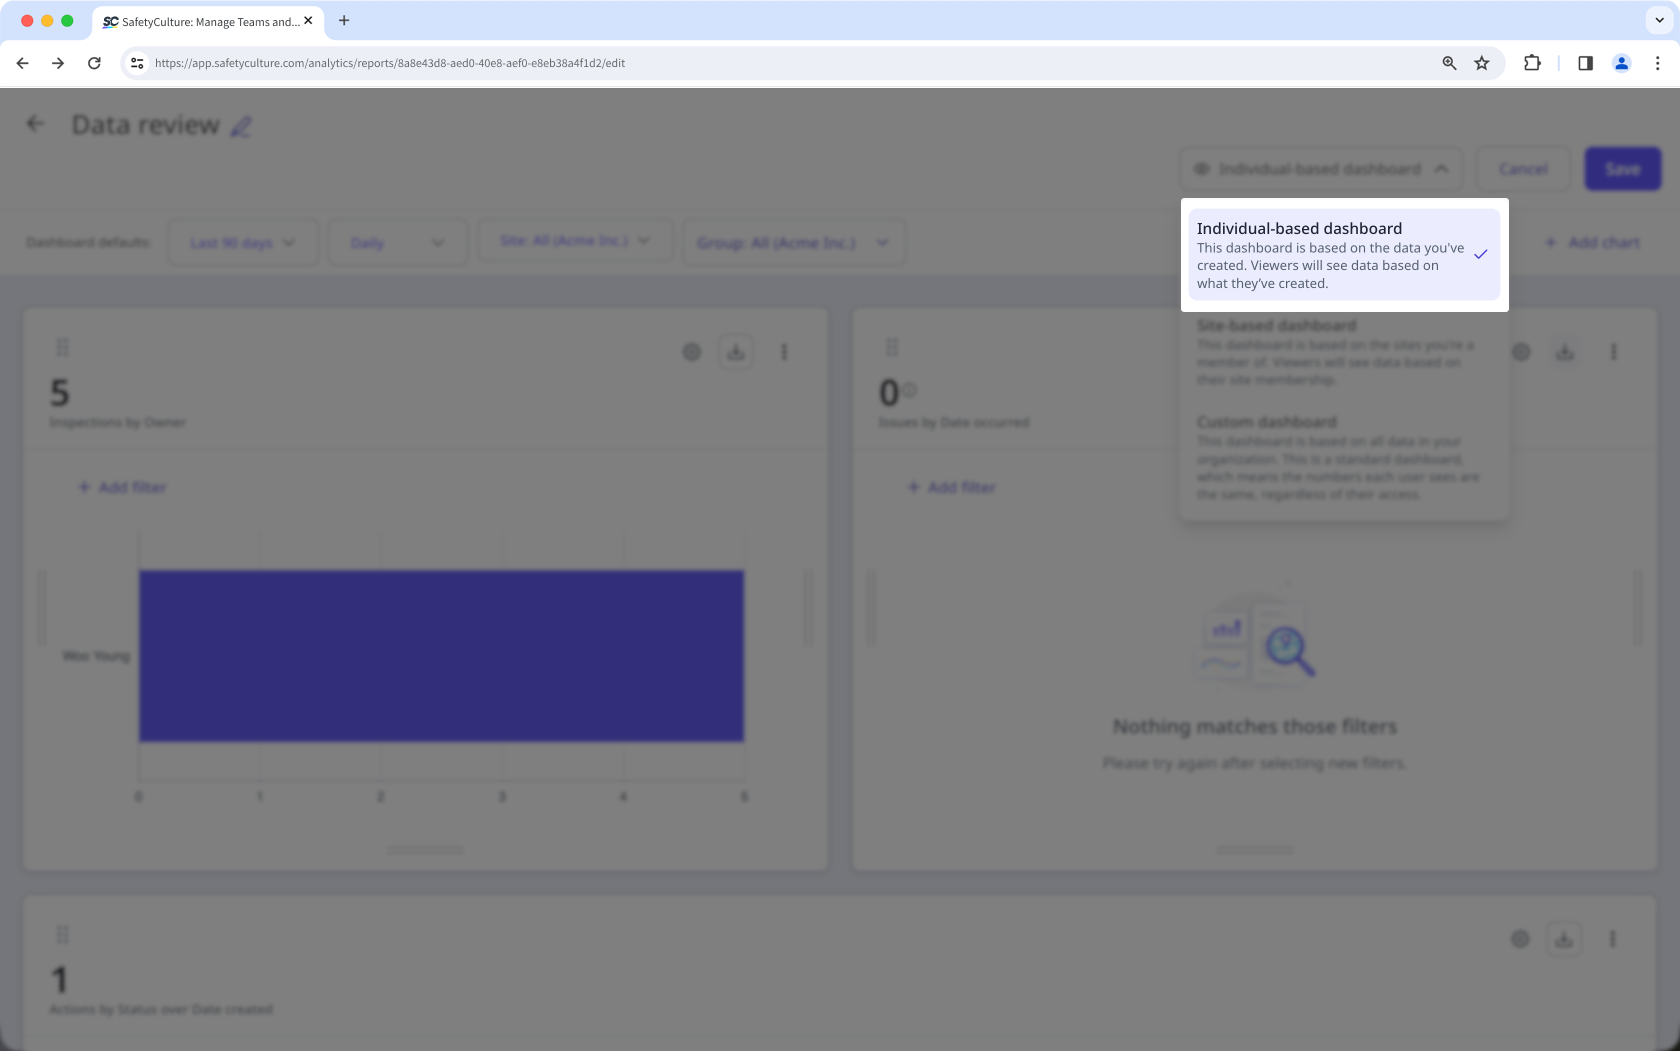
For example, if John creates an individual-based dashboard, he'll only see inspections, actions, etc., that he has created. When he shares the dashboard with Jane, Jane will see a different set of data based on the inspections, actions, etc., that she has created.
Multiple charts
Adding multiple charts to your Analytics dashboard allows your team to view insights from different data sources, identify trends, and compare metrics in one integrated dashboard.
Dashboard filters
Filter your Analytics dashboard to focus on the most significant data for your organization. Set a custom date range, select relevant sites, and select specific groups to filter your data and visualize trends.
Dashboard sharing
After customizing your Analytics dashboard, you can share it with specific groups or provide access to everyone in your organization. This allows you to control access based on roles or specific needs, ensuring relevant data is only available to the appropriate teams.
Dashboard customizability
Since charts can sometimes occupy too much screen space, you can resize your charts to quickly view and analyze data. Optimize your dashboard by resizing charts and customizing data visibility to display zero values or hide total metric counts, ensuring your team can quickly find the most relevant information. 
Dashboard exports
Export your Analytics dashboard to save a snapshot of all your charts in one file. Your team can then share reports across the organization or review trends outside the platform without downloading each chart separately.