What does it mean to customize data visibility?
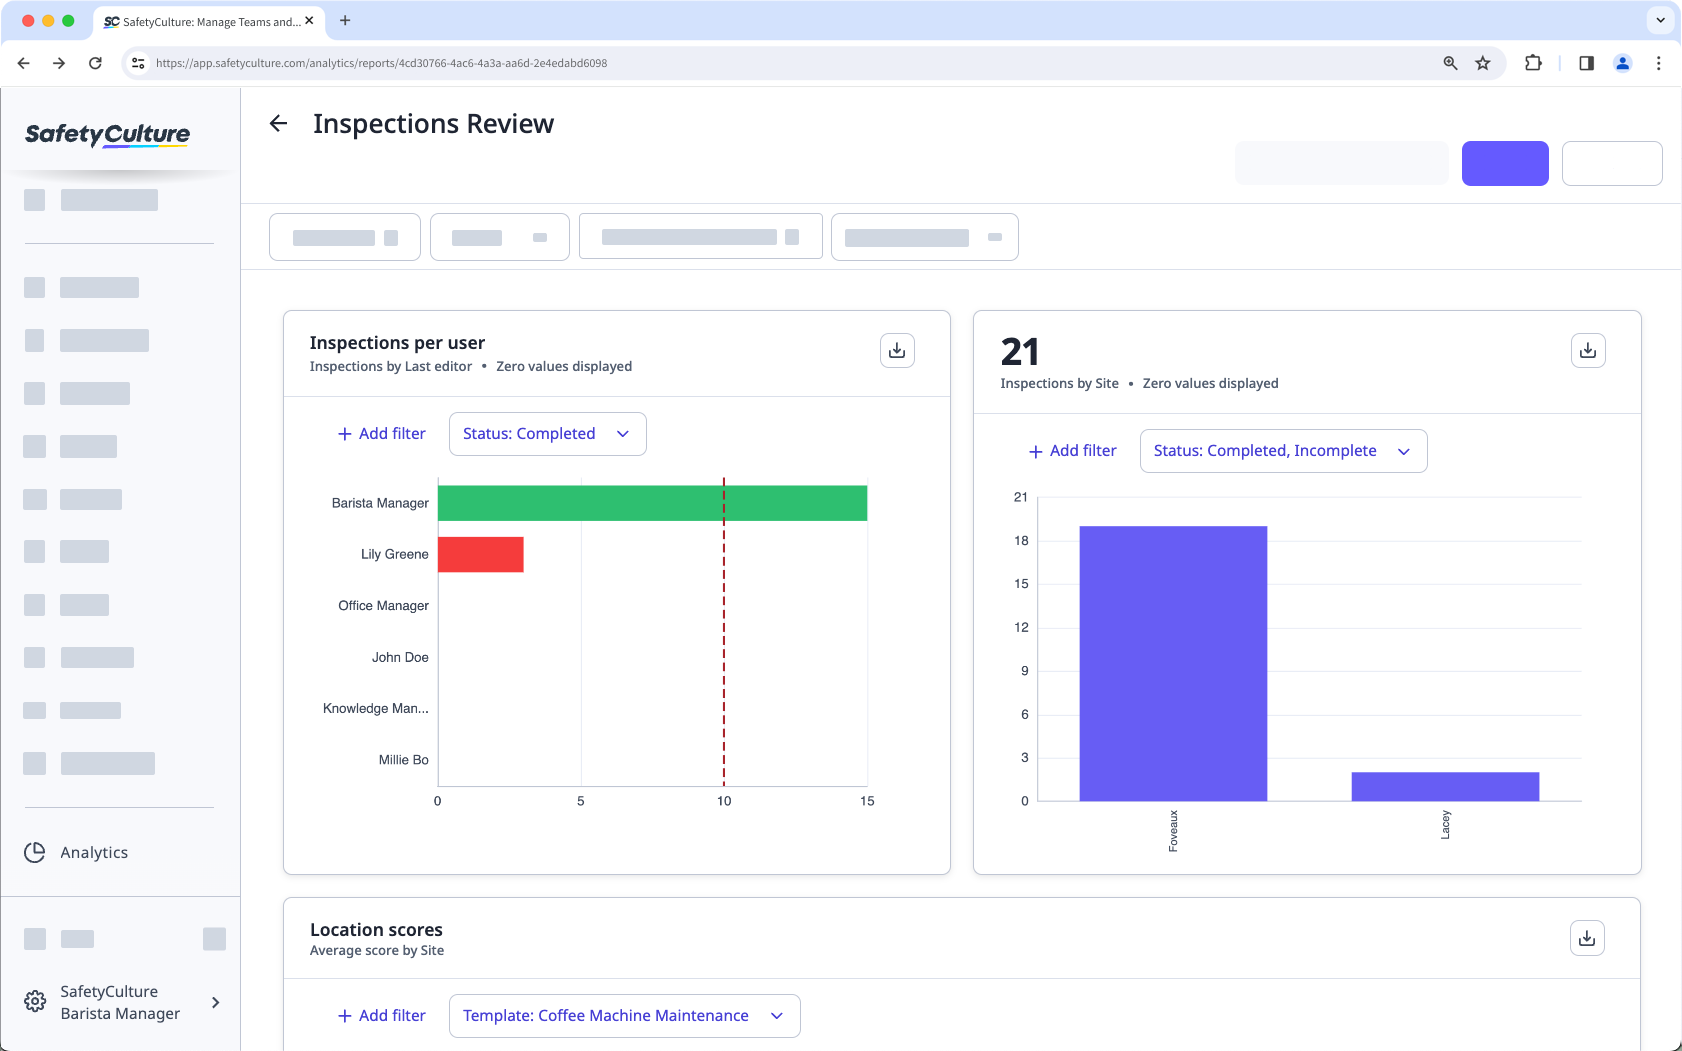
To get the most out of your Analytics dashboards, it’s essential to have control over the data you choose to display. Customizing data visibility in charts allows you to show or hide zero values, enabling exception-based reporting to spotlight your team’s successes and identify areas for improvement.
Additionally, you can hide the total metric count from your charts, reducing noise in your dashboards and ensuring that the most relevant information stands out. This level of customization enhances clarity and empowers your team to focus on what truly matters.
What you'll need
Non-count metrics such as "Average duration", "Average score", etc. will display zero values by default.
Customize a chart’s data visibility
Select Analytics in the sidebar or select it in More.
Click on the upper-right corner of the chart.
In the side panel, click Chart settings and select Data visibility.
In the side panel, turn the data visibility settings on or off as needed.
Display items with zero values: Display or hide values where no data has been created.
Hide total metric above chart: Display or hide the total count based on your configured metric and attribute on the upper-left of the chart.
Click Save chart on the upper-right of the page to save the changes to the chart.
Click Save on the upper-right of the page to save the changes to your dashboard.
For charts with multiple attributes configured, zero values are only displayed for the first attribute, except for the "Timeline table" chart type.
Limitations
Displaying zero values is currently unsupported for the following chart settings:
Metrics | Attributes | Chart types |
|---|---|---|
Scheduled inspections | Status (Inspections, Actions, and Issues) | Pie |
Completed inspections (Scheduled) | Question (Inspections) | Dial |
Page / Section / Question (Inspections) | Responses table | |
Priority (Actions and Issues) | ||
Type (Actions) |