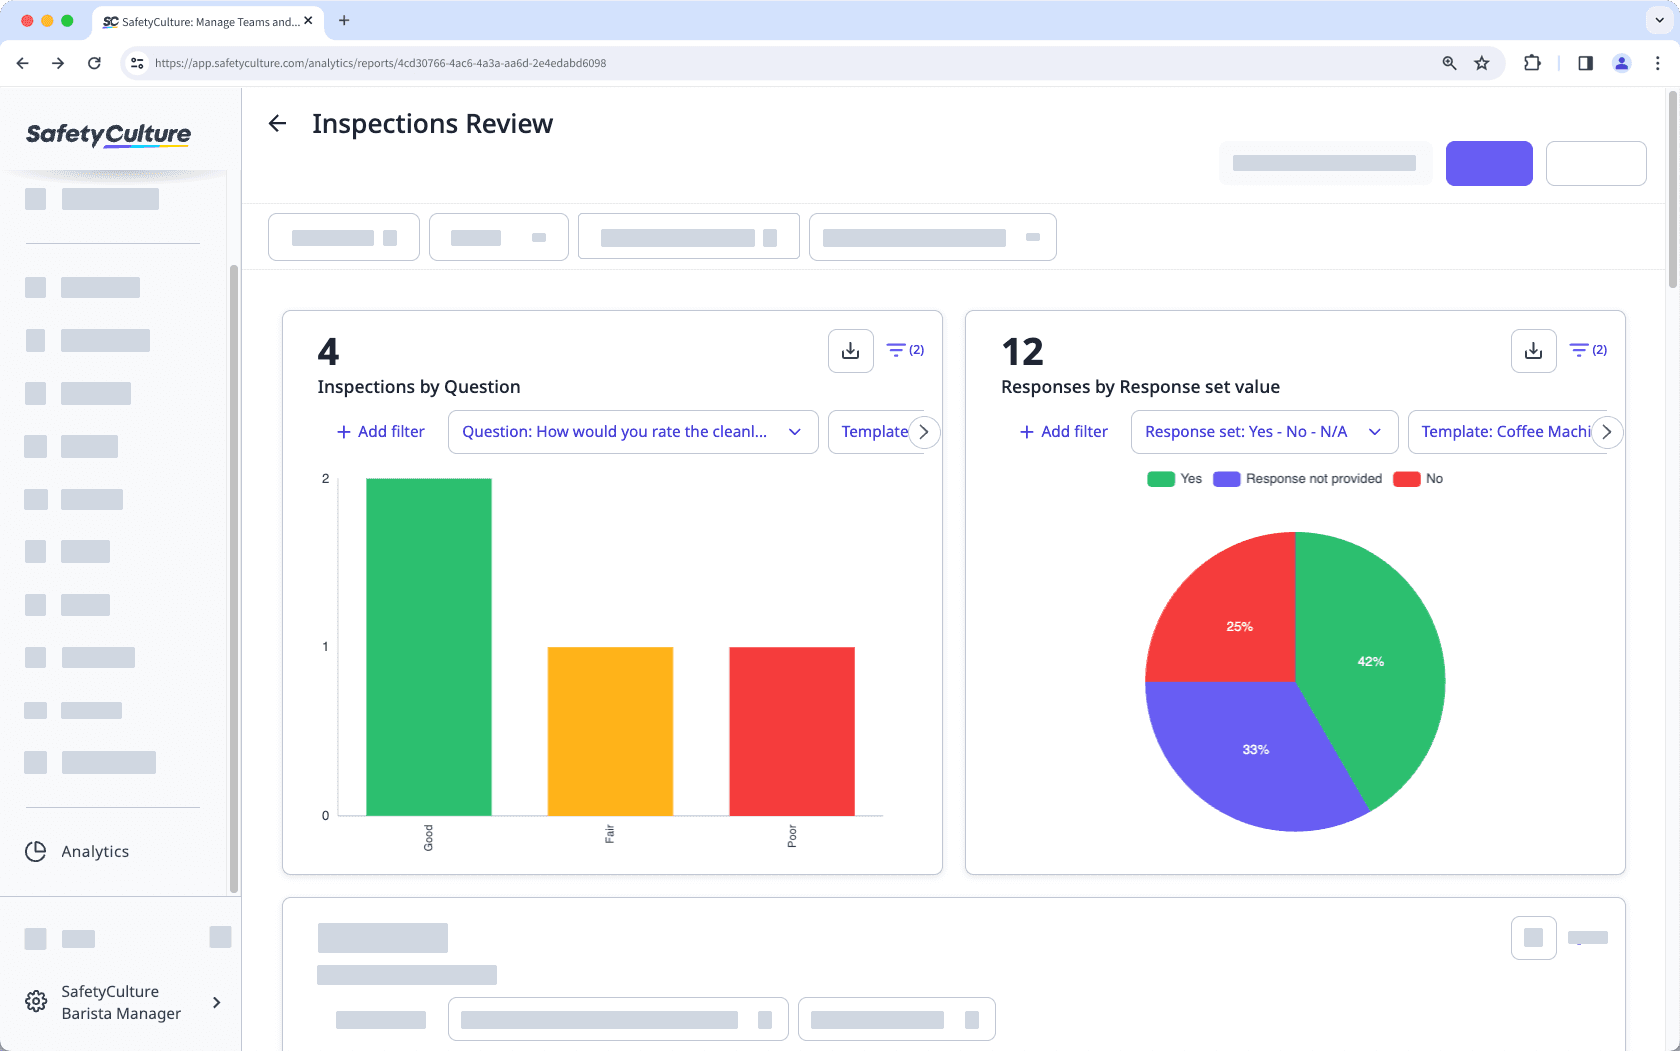
Ver inspecciones por preguntas y respuestas en Estadísticas
Aprenda a ver las inspecciones por preguntas y respuestas en la función de Estadísticas a través de la aplicación web.¿Qué significa ver las inspecciones por preguntas y respuestas en Estadísticas?
Filtrar sus datos de inspección por las preguntas le permite identificar fácilmente patrones, tendencias y áreas de mejora. Al comprender cuántas veces se seleccionan respuestas específicas en las inspecciones, puede identificar rápidamente áreas de interés, lo que le permite priorizar sus esfuerzos para abordar primero los hallazgos con más impacto.

Ver inspecciones por pregunta
Seleccione
Estadísticas en el menú de la izquierda.
Haga clic en
Crear panel en la esquina superior derecha de la página.
Haga clic en
Seleccionar métrica en la parte superior izquierda del gráfico y seleccione
Seleccionar métrica.
Haga clic en Seleccionar atributo en la parte superior izquierda del gráfico y seleccione Seleccionar atributo.
Haga clic en Seleccionar una pregunta y, a continuación, seleccione la plantilla y la pregunta que desee analizar en el menú desplegable. Seleccionar una pregunta
Haga clic en Hecho.
Haga clic en el icono de gráfico situado en la parte superior derecha del gráfico y, a continuación, seleccione el tipo de gráfico que desee utilizar para visualizar los datos.
Haga clic en Guardar en la esquina superior derecha de la página.
El recuento total de inspecciones en el gráfico refleja el número de respuestas obtenidas para la pregunta seleccionada. Por ejemplo, si un usuario selecciona «Sí», «No» y «N/A» para la misma pregunta, se contabilizará cada respuesta, dando como resultado un total de 3 inspecciones.
Ver inspecciones por conjunto de respuestas
Seleccione
Estadísticas en la barra lateral o selecciónelo en
Más.
Haga clic en el menú desplegable debajo de “Métrica” y seleccione Respuestas. El Atributo se establecerá en Valores del conjunto de respuestas de forma predeterminada.
Si va a crear un nuevo panel, haga clic en
Seleccionar métrica y seleccioneRespuestas.
Haga clic enSeleccionar conjunto de respuestas y seleccione el conjunto de respuestas que desea utilizar.
Haga clic en el menú desplegable en "Tipo de gráfico" y seleccione el estilo de gráfico pertinente para sus datos.
Haga clic en Guardar gráfico en la parte superior derecha de la página para guardar los cambios en el gráfico.
Haga clic en Guardar en la parte superior derecha de la página para guardar los cambios en su panel.
Si ha editado un conjunto de respuestas predeterminado y desea usarlo para ver sus datos de inspección, le sugerimos filtrar con una plantilla específica para asegurarse de obtener los datos correctos.
También puede utilizar el filtro «Pregunta y respuesta» para acotar aún más los datos.
Limitaciones
Solo puede filtrar datos seleccionando conjuntos de respuestas predeterminados y conjuntos de respuestas globales. Los conjuntos de respuestas predeterminados se añaden automáticamente al crear una nueva plantilla. Sin embargo, al cambiar el nombre, eliminar o añadir nuevas respuestas, estas aparecerán como marcadores de posición numéricos en los gráficos.
El atributo «Pregunta» solo admite preguntas de opción múltiple, incluidos los conjuntos de respuestas personalizados y los conjuntos de respuestas globales.
Los gráficos con varias métricas seleccionadas no pueden utilizar el atributo «Pregunta».
Preguntas frecuentes
«Pregunta no encontrada» significa que la pregunta ha sido eliminada de la plantilla. Tenga en cuenta que eliminar una pregunta de una plantilla y, más tarde, volver a crear la misma pregunta no la vinculará con la pregunta anterior de ninguna manera.
Los marcadores de posición numéricos (como [1], [2], y así sucesivamente) indican que la respuesta ha sido añadida recientemente, cambiada de nombre o eliminada de la plantilla.
¿Esta página le fue de ayuda?
Gracias por hacérnoslo saber.