Apply Analytics filters
Learn what dashboard and chart filters are available in Analytics and how to apply them via the web app.What chart filters are available?
The completion status of the inspection, action, issue, schedule, or Heads Up.
Inspections: Completed, Archived, or In progress. Filtering inspections by the "Archived" status will show inspections regardless of whether they’re complete or in progress.
Actions: To do, In progress, Complete, or Can't do.
Issues: Open or Resolved.
Schedules (legacy experience): To do, In progress, Completed, Missed, Overdue, or Late completion.
Schedules (new experience): In progress, Completed, Won't do, or Missed.
Heads Up: Incomplete or Complete.
The template used to conduct the inspections.
The asset of an inspection, action, or schedule (new experience).
Filtering by asset is only available when the "Asset type" filter isn't applied.
The selected type of asset.
Filtering by asset type is only available when the "Asset" filter isn't applied.
The response entered or selected in inspections.
The selected flagged responses in inspections. Flagged responses must be set up in your templates to capture data accurately. Please note that the flagged responses filter is only available in the Responses table chart types when tracking inspection responses.
The priority of the action or issue.
The label of an action.
The type of an action.
The schedule linked to an inspection.
Charts show high-level data, but visibility in chart drill-downs depends on the user's permissions:
No "Schedules" permissions: No schedules are visible.
"Schedules: Create" permission: Only schedules created or assigned to the user are visible.
"Schedules: Manage" permission: All schedules in the organization are visible.
The category of the issue.
Filtering by status will filter archived inspections regardless of whether they’re complete or incomplete.
What dashboard filters are available?
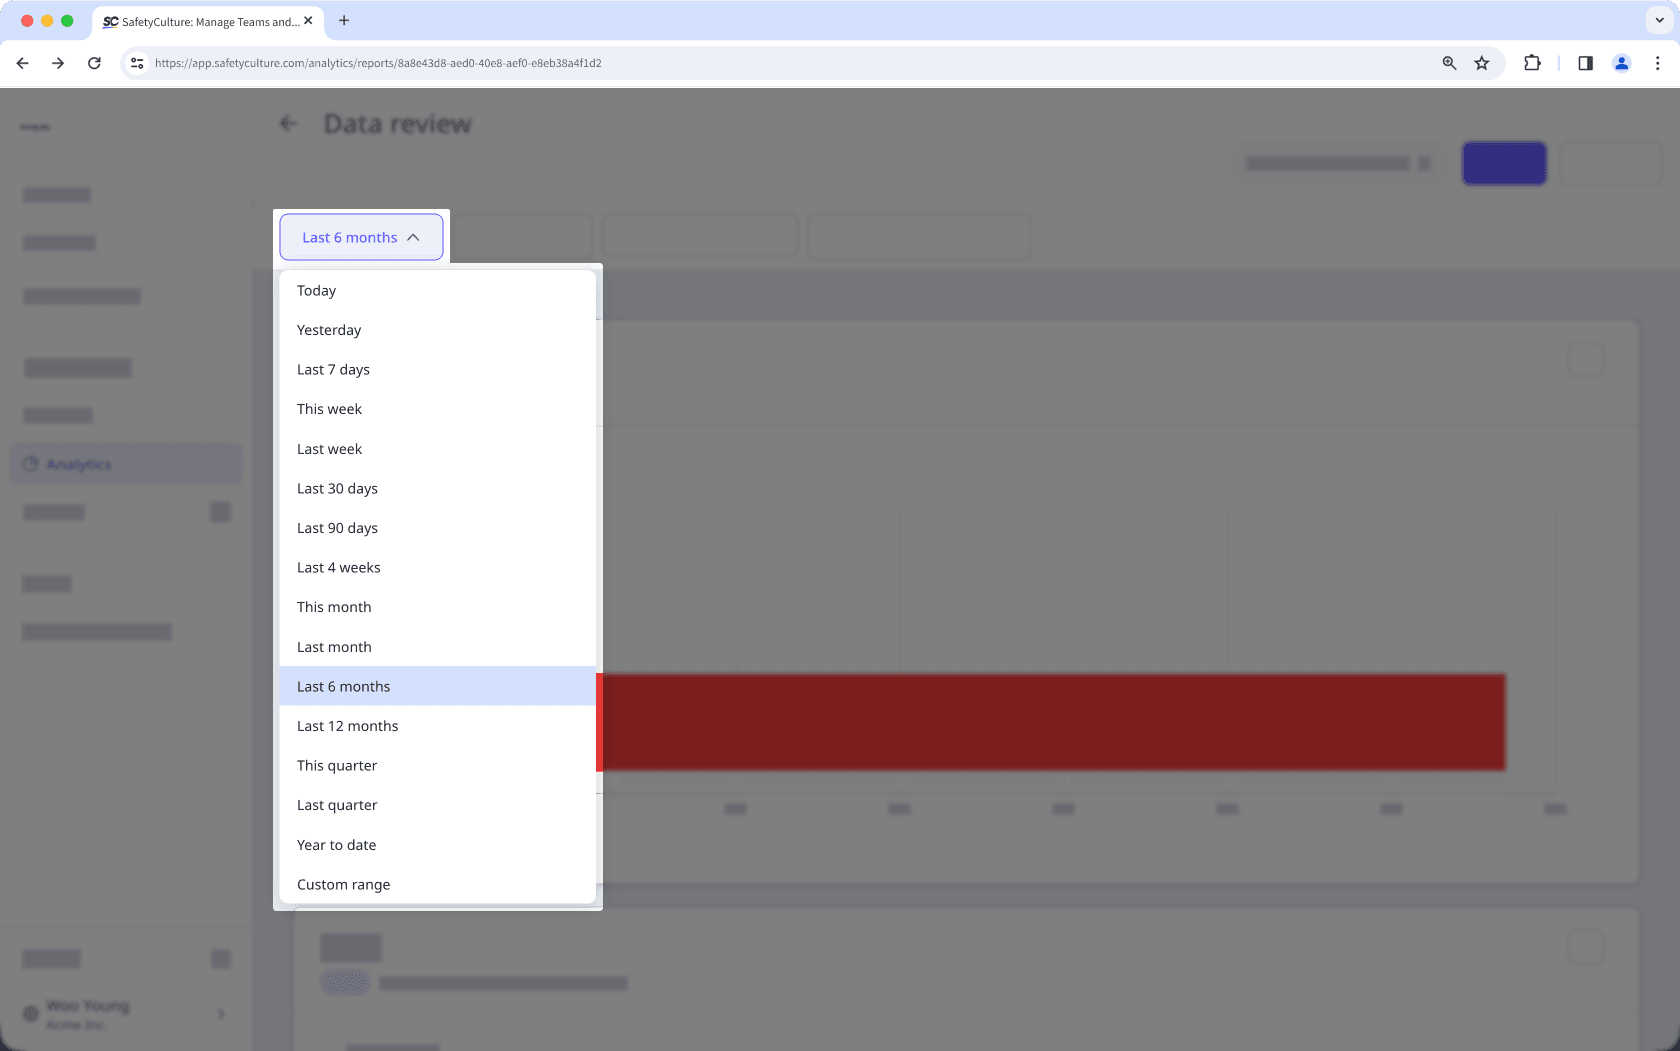
The date range to filter data by. You can only filter data for a maximum of 3 years at a time when using “Custom range”.
Inspections, Actions, and Issues: Filters by the date an inspection, action, or issue was created.
Schedules: Filters scheduled inspections by the start date of the schedule window. For example, if a schedule is set to occur every 15th of the month, the schedules will be displayed as "January 15", "February 15", and so on.
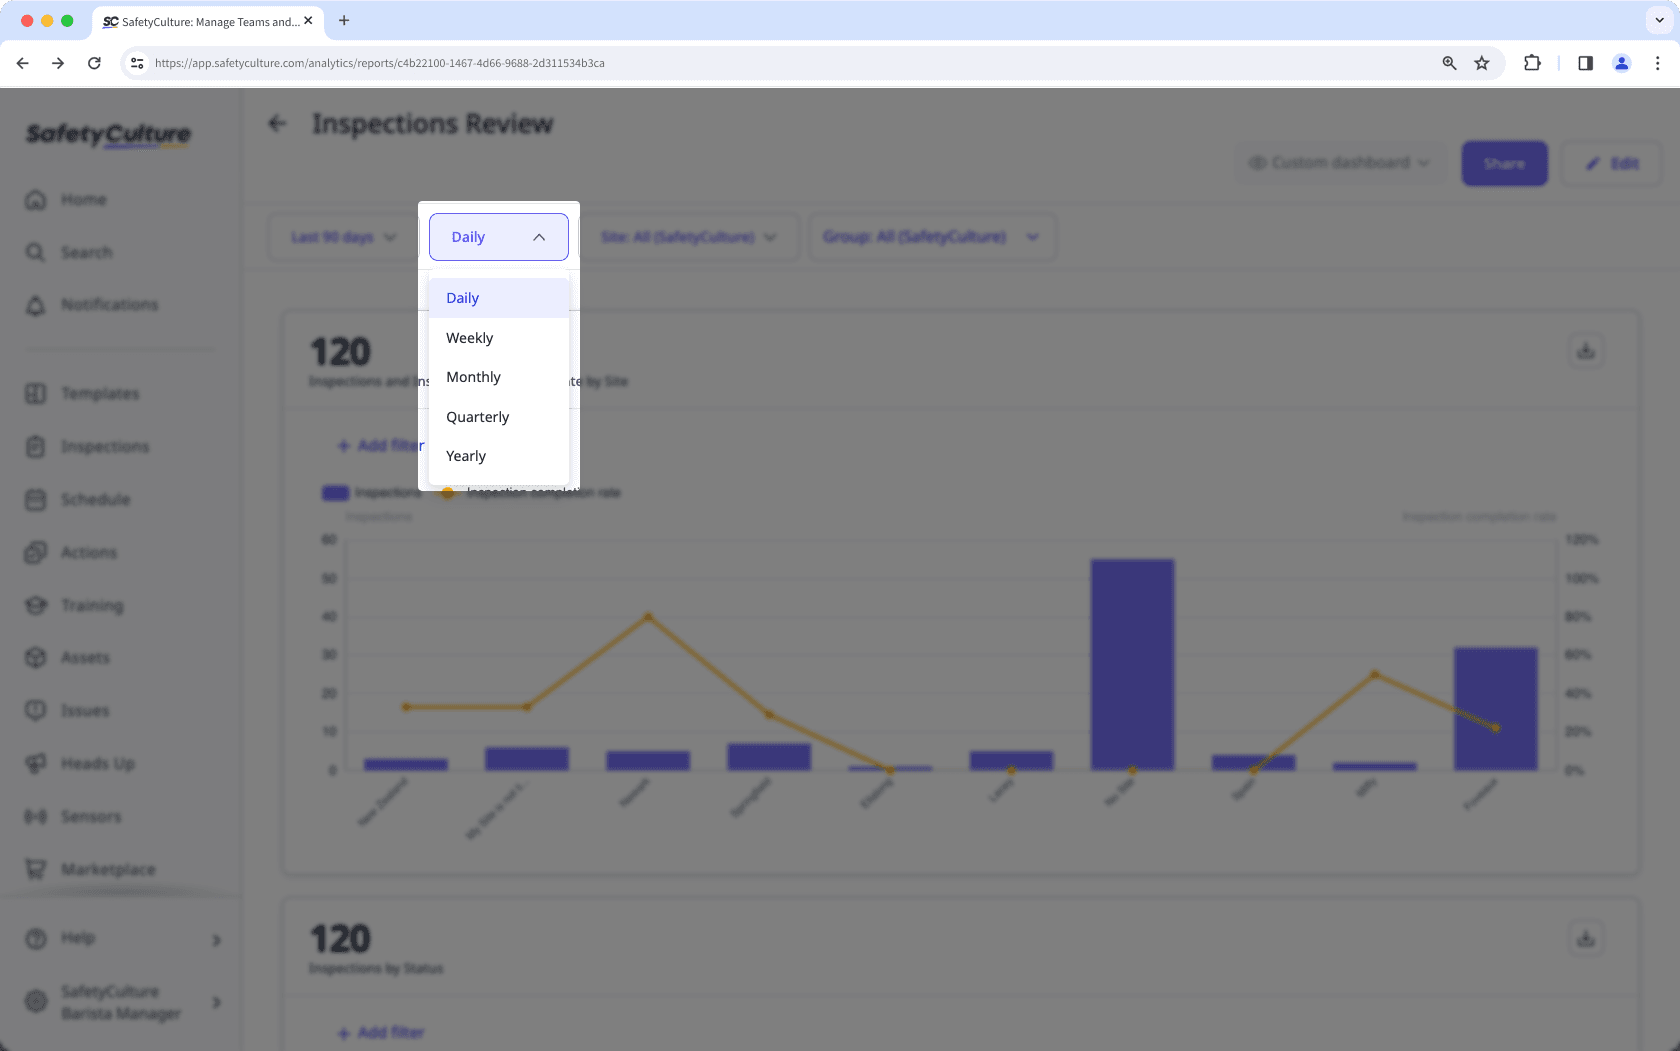
The frequency to group data by based on when they were created.
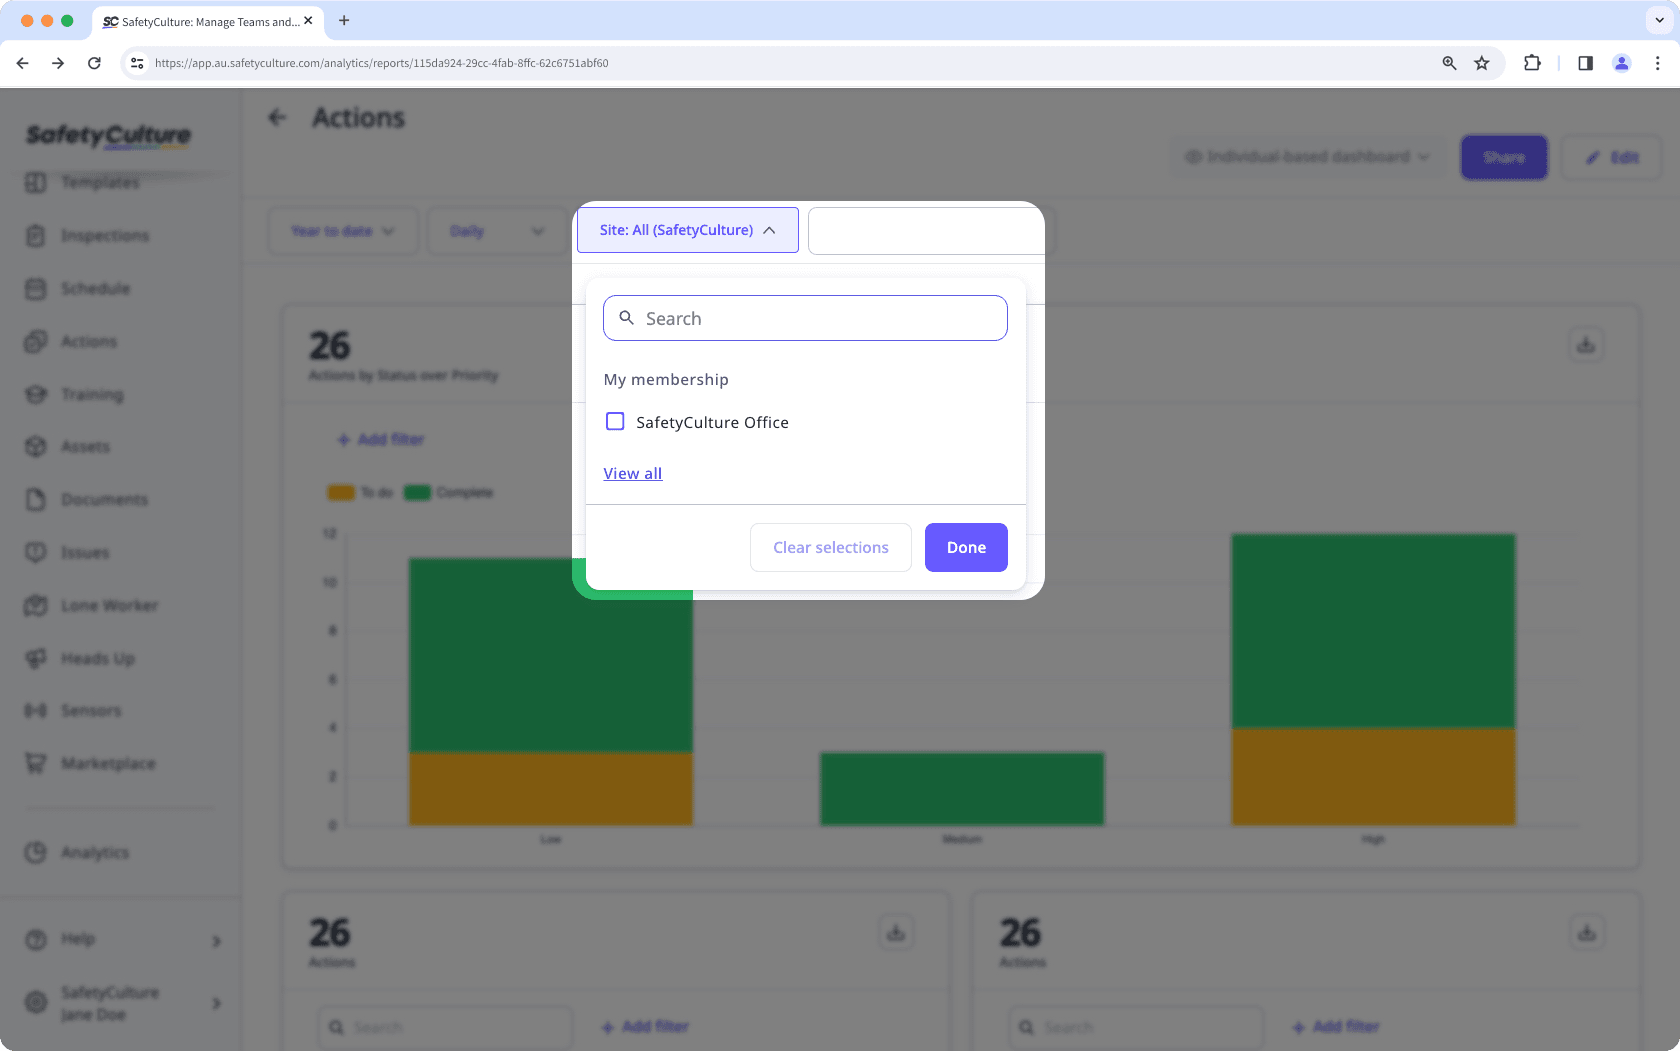
The site or level to filter data by.
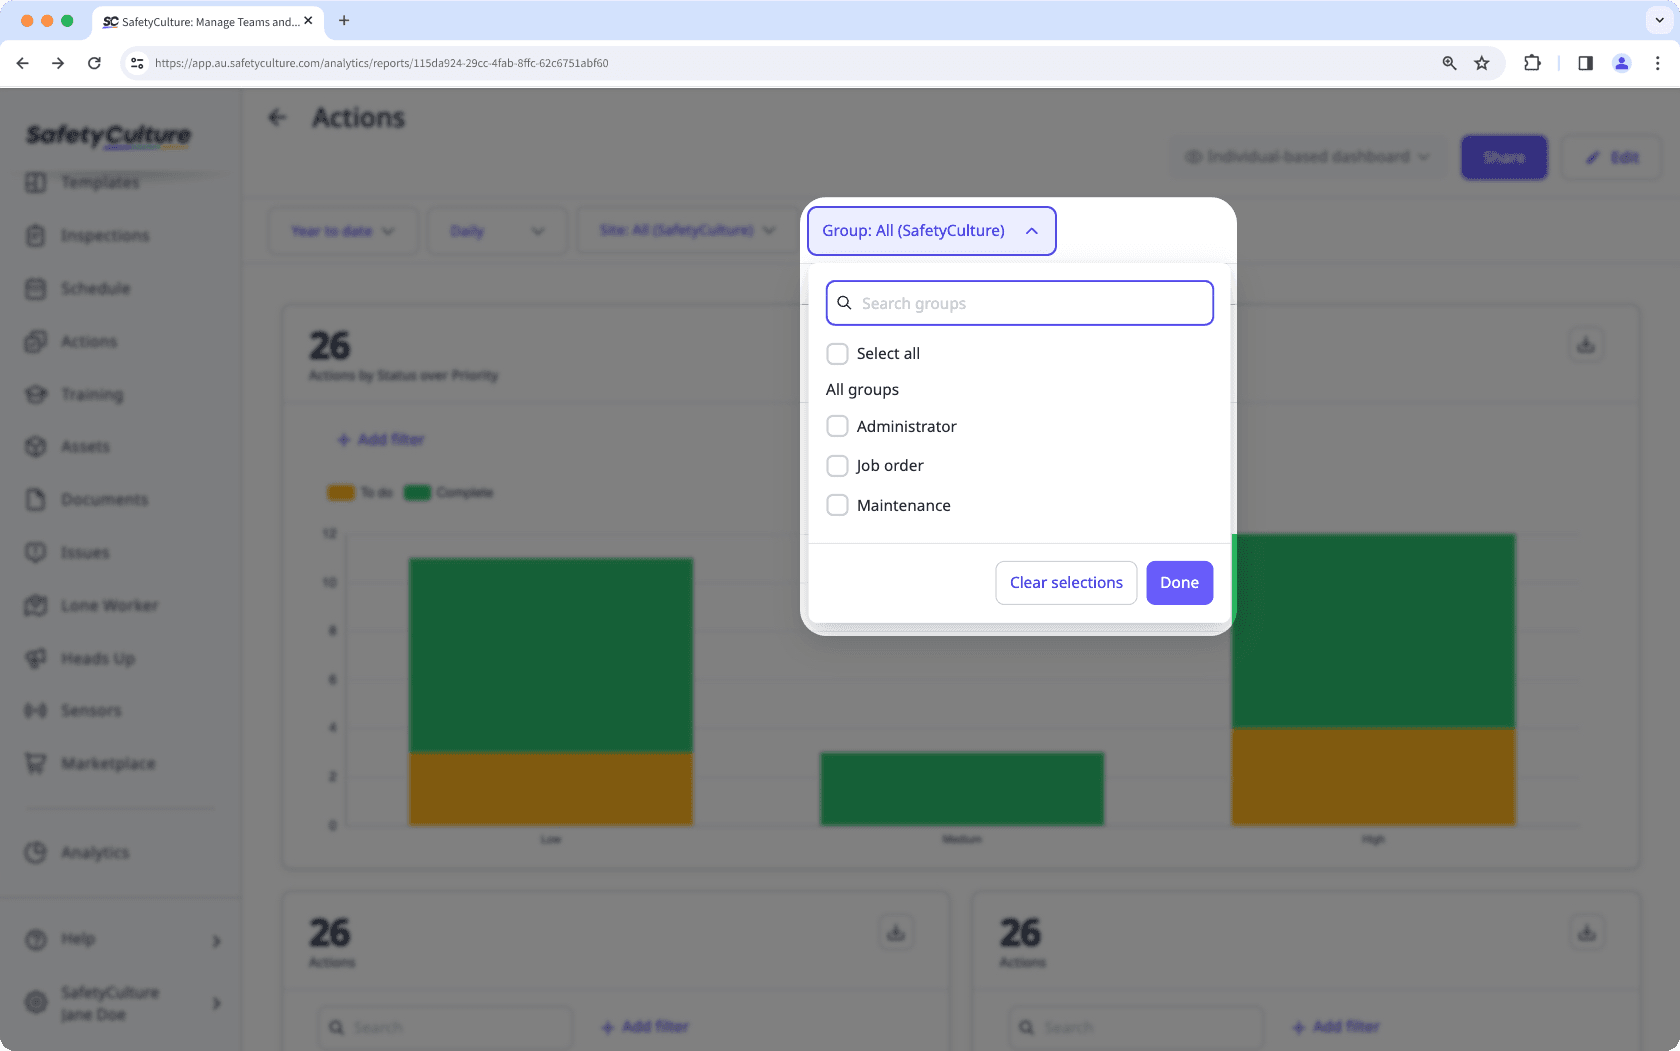
The group to filter data by. Depending on the metric that you've selected for a chart, the filter may work differently:
Inspections: Filters based on the last editor of the inspection. If multiple users have edited an inspection, the inspections are shown based on the last person who edited it, if they’re in the group you’re filtering by.
Actions and Schedules: Filters based on assignees. This works for both assigned to groups and individual users, where users in the group you’re filtering by will also be displayed.
Issues: Filters based on issue assignees, where issues assigned to users in the group you're filtering by will be displayed.
You can select up to 1,000 filters per dashboard and chart filter at a time in New Analytics. For example, you can select 1,000 templates and 1,000 sites to filter your data.
Apply Analytics filters
Select
 Analytics in the sidebar or select it in
  More.
More.On this page, you can:
Filter your dashboard by a predefined or custom date range, set the period interval, relevant group, and depending on the type of dashboard, filter by sites.
Depending on your access to the dashboard and the chart type, you can also customize each chart's filter to show more relevant results.
Frequently asked questions
"This quarter" and "Last quarter" filter data by the current or previous calendar quarter, depending on the data type:
Inspections, Actions, and Issues: Filter by the date an inspection, action, or issue was created.
Schedules: Filter scheduled inspections by the start date of the schedule window. For example, if a schedule is set to occur every 15th of the month, the schedules will be displayed as "January 15", "February 15", and so on.
“Last 7 days” takes into account the date when you view the dashboard. For example, if you view a dashboard with the filter on September 9, you’ll see data created from September 2 to 9.
On the other hand, “Last week” will show data created from Monday to Sunday of the previous week, regardless of when you view the dashboard. For example, if you view a dashboard with the filter on September 9, you’ll see data created from September 1 to 7.
Was this page helpful?
Thank you for letting us know.