We currently have a legacy and a new experience with the Schedules feature. This article covers the new Schedules experience.
Why track scheduled inspections in Analytics?
Tracking inspection schedules helps you oversee your team's progress, make sure inspections are completed on time, and identify compliance gaps. By using Analytics to monitor scheduled inspections across assignees, sites, and assets, you can spot missed or overdue inspections early, act before they become audit or safety risks, and maintain a clear record of operational performance.
For example, you can use scheduled inspections data in Analytics to:
Identify which sites or assignees have the most missed inspections.
Compare completion rates across teams to surface accountability gaps.
Review historical scheduling performance ahead of an audit.
What you'll need
Supported chart types
The chart types available depend on the metric you select.
Metric | Supported chart types |
|---|---|
Scheduled inspections (Count) | • Stacked • Column • Grouped • Bar • Pie • Line • Table • Dual-axis |
Completed inspections (Count) | • Table • Dual-axis |
Limitations
Inspections that are still in "To do" will not appear in charts.
The Schedules data type is incompatible with Individual-based dashboards.
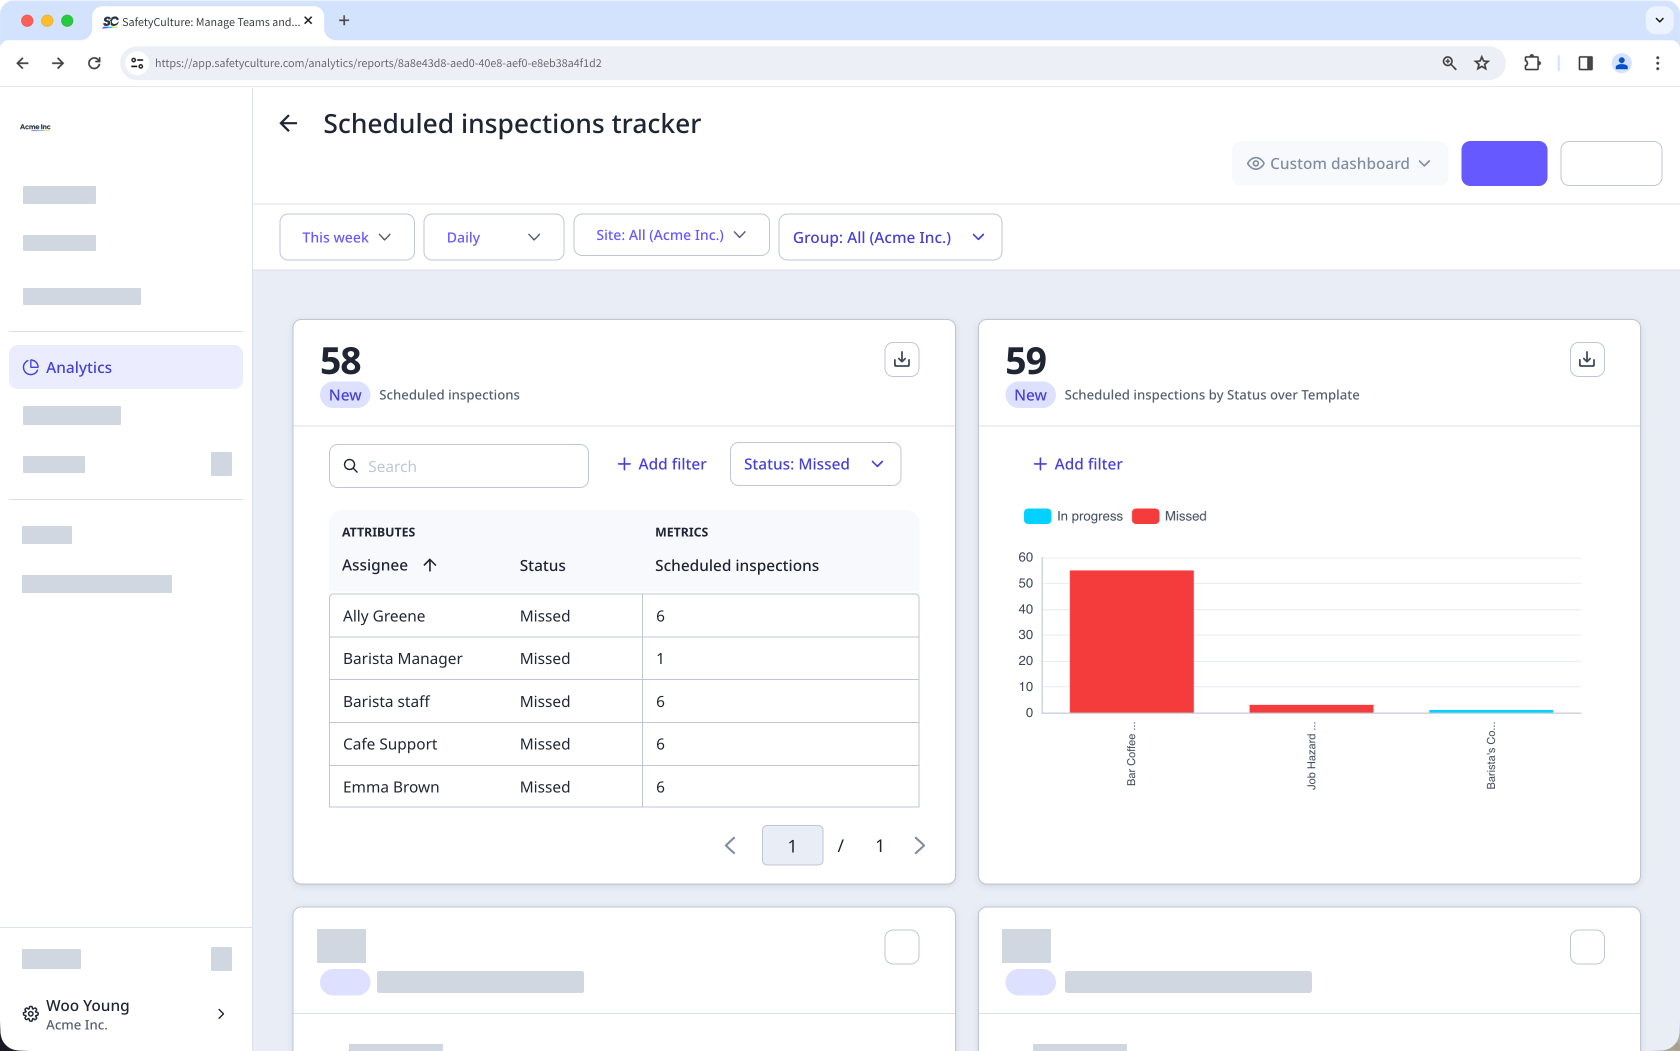
Track scheduled inspections
Select Analytics in the sidebar or select it in More.
In the chart builder, configure the data type and metric:
Data type: Select Schedules (New) on the upper-right of the page.
Metric: Select Scheduled inspections or Completed inspections from the dropdown.
Configure your chart accordingly.
Click Save chart on the upper-right of the page.
Click Save on the upper-right of the page.
Charts show high-level data, but visibility in chart drill-downs depends on the user's permissions and any schedule-level access they've been given:
No "Schedules" permissions: Only schedules the user has been given View, Edit, or Owner access to are visible.
"Schedules: Create" permission: Only schedules created or assigned to the user, plus any schedules they've been given access to, are visible.
"Schedules: Manage" permission: All schedules in the organization are visible.