Dernière mise à jour:

Afficher les performances des inspections dans Données analytiques

Comment afficher et interagir avec les scores des inspections de votre organisation dans la fonctionnalité Données analytiques sur l'application Web ?

Pourquoi visualiser les performances d'inspection dans Analyses de données ?

La performance des inspections permet de suivre le score que les utilisateurs ont obtenu pour chaque inspection. Cela vous permet de repérer les tendances au sein de votre organisation et de résoudre les observations qui pourraient être à l'origine des mauvais scores.

si vous utilisez les Nouvelles Données Analytiques, Les données affichées dépendent des informations auxquelles vous avez accès dans SafetyCulture et du type de tableau de bord que vous utilisez. Découvrez comment obtenir l'accès aux inspections ou vous attribuer l'autorisation « accès aux données » pour obtenir une visibilité sur l'ensemble des modèles et des inspections de votre organisation.

Comment fonctionne le score dans les Données analytiques ?

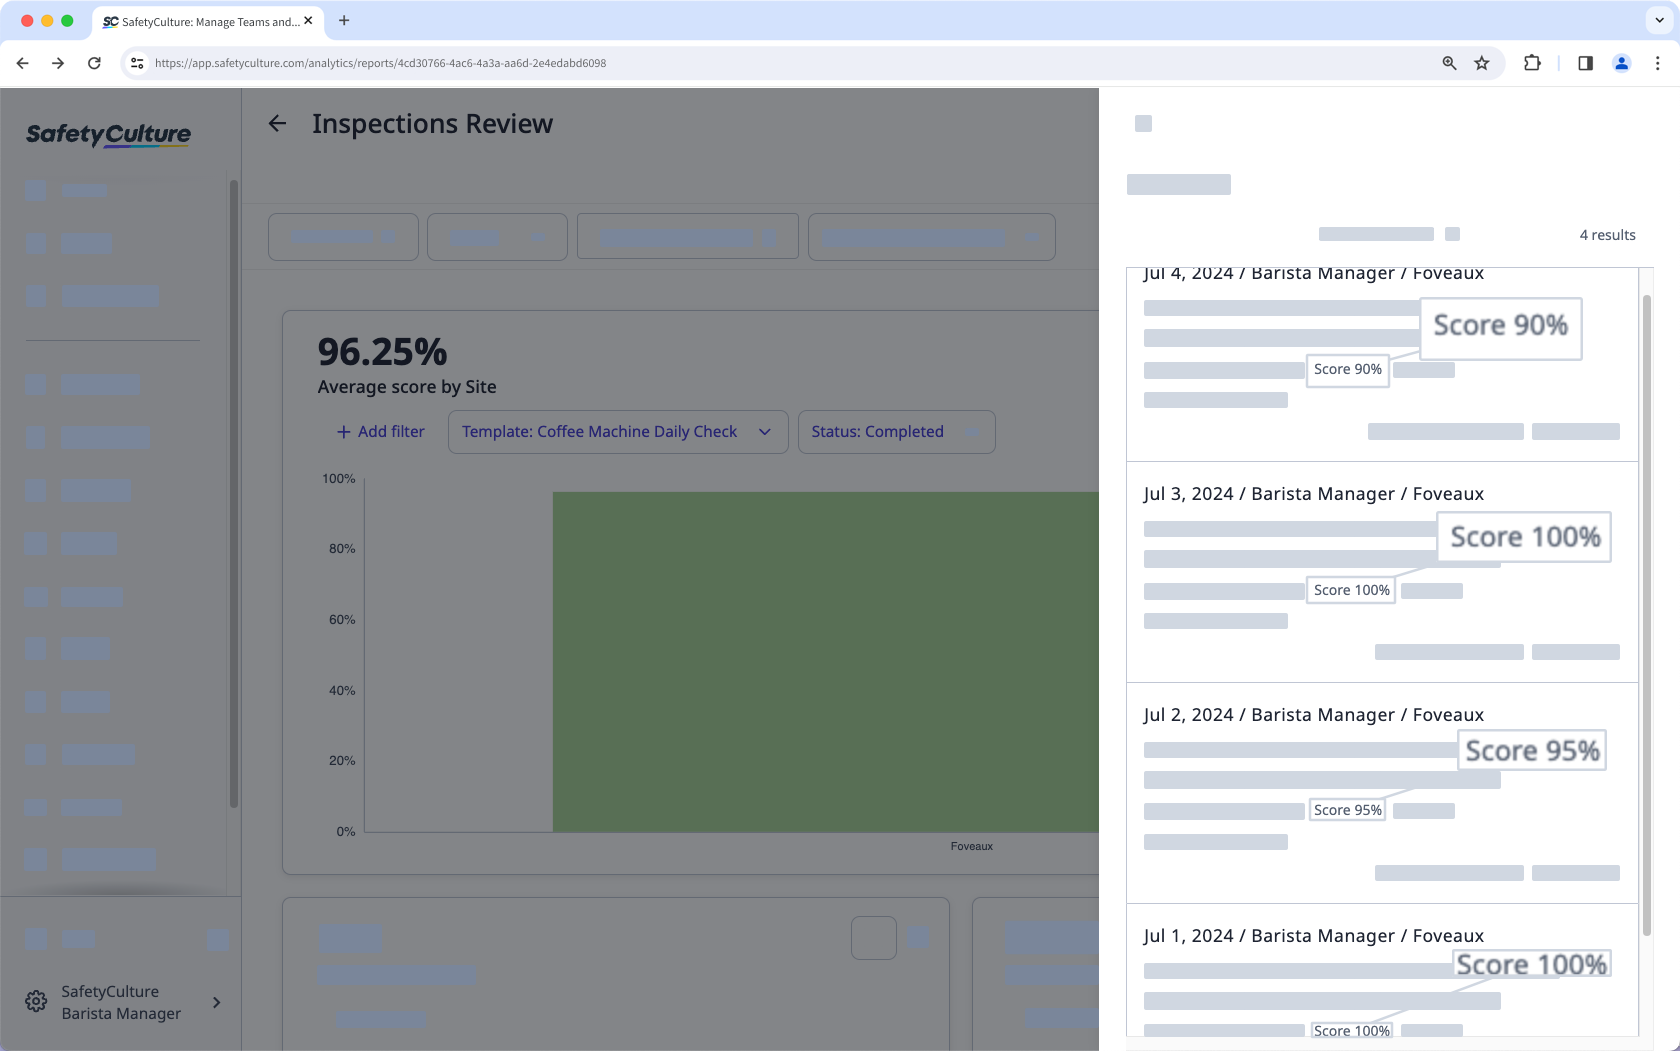
Le score moyen dans les données analytiques est calculé en additionnant tous les pourcentages de score, puis en les divisant par le nombre d'inspections.

Par exemple, si vous avez 4 inspections avec des scores de 90 %, 100 %, 95 % et 100 %, le score moyen est calculé comme suit :

  • (90+100+95+100)/4 = 96,25 %

Dans l'héritage des données analytiques, la note moyenne est calculée au niveau de chaque question. Cela signifie que tous les scores obtenus par un utilisateur sont additionnés et divisés par le score maximal possible pour l'inspection, puis multipliés par 100 pour obtenir un pourcentage.

Par exemple, vous avez 4 inspections avec un score total de 182,75, et le score maximum possible est de 190. En divisant ces résultats et en les multipliant par 100, vous obtenez une note moyenne de 96,18 %.

Vous pouvez vérifier le score d'une inspection en consultant le rapport d'inspection. Dans cet exemple, le score total de l'élément est de 45, tandis que le score maximum est de 50.

Vous devez configurer le score dans vos modèles pour capturer et suivre les scores des questions ou des éléments dans votre organisation.

Afficher les résultats de l'inspection

  1. Log in to the web app.

  2. Select Pie chart iconDonnées analytiques from the menu on the left-hand side.

  3. Edit an existing dashboard or create a new one.

  4. Create a new chart and select Score moyen as the metric.

  5. Select your preferred attribute and chart type.

  6. Click Enregistrer on the upper-right of the page.

  1. Connexion à l'application Web.

  2. Sélectionnez Pie chart iconDonnées analytiques dans le menu à gauche.

  3. Appliquez vos filtres et sélectionnez l'onglet Performance en haut de la page.

  4. Sur cette page, vous verrez un graphique et un tableau, qui présentent tous deux les données relatives aux performances d'inspection. Vous trouverez ci-dessous plus d'informations sur le graphique et le tableau, ainsi que sur la manière dont vous pouvez les utiliser.

Fields in Legacy Analytics

Chart fields

Field

Description

The data

This chart shows the average inspection score each day, week, month, quarter, or year, depending on how you've applied your date period filter.

Visualization

By default, the chart is visualized as a line chart. But you can convert it to a bar chart by toggling the visualization on the upper-right of the chart.

Export chart

If you require the chart for reporting purposes, you can export the chart as an image file by clicking Exporter on the upper-right of the page and selecting Graphique au format PNG.

View inspections containing flagged items

You can interact with the chart to identify which specific inspections achieved the average on a day, week, month, quarter, or year, by hovering your cursor over the dot or bar to see the average score in the pop-up, and clicking AFFICHER LES INSPECTIONS. This lists all the inspections within the selected period that contain flagged items, which you can export via the Exporter option on the upper-right corner of the page.

Table fields

Field

Description

The data

This table, by default, displays details on the owner, the average score, and the total number of inspections conducted over the period of time. If you want to view performance based on other metrics, you can also sort the table with the following elements by clicking the down arrow on the upper-left corner of the table.

Author: The user who last edited the inspection.

Region: The region of an inspection's selected site.

Area: The area of an inspection's selected site.

Site: The selected site of an inspection.

Template: The template of an inspection.

The table, by default, shows the average score for each question on each day, week, month, quarter, or year, depending on how you've applied your date filter. You can adjust the table to display the minimum or maximum score by clicking the down arrow under % de SCORE on the upper-left of the table.

Export table

If you require the table for reporting purposes, you can export the table as a CSV file by clicking Exporter on the upper-right of the page and selecting Tableau CSV.

View all inspections

If you want to see the total number of inspections based on how you sorted the table, you can do so by clicking either the sorting label or the total number of inspections on the right-hand side of the row. This lists all the inspections based on the sorting, which you can export via the Exporter option on the upper-right corner of the page.

View inspections based on minimum, average, or maximum score

If you want to see only the inspections that achieved a specific minimum, average, or maximum score on a day, week, month, quarter, or year, you can do so by clicking the score percentage in the table. This lists all the inspections, which you can export via the Exporter option on the upper-right corner of the page.

Besoin d'aide supplémentaire?
Dans cet article