- Usar SafetyCulture
- Estadísticas
- ¿Qué son los paneles de Estadísticas?
¿Qué son los paneles de Estadísticas?
Obtenga un resumen de los paneles de Estadísticas en SafetyCulture.¿Qué son los paneles de Estadísticas?
La función de Estadísticas le permite ver todos sus datos en un solo lugar, aunque esto a veces puede ser abrumador para grupos o usuarios que no necesitan una visibilidad completa. Al crear paneles de Estadísticas individuales, puede gestionar el flujo de datos en toda su organización para que las partes interesadas solo vean la información más relevante para ellas.
Explorar paneles de Estadísticas
Tipos de paneles
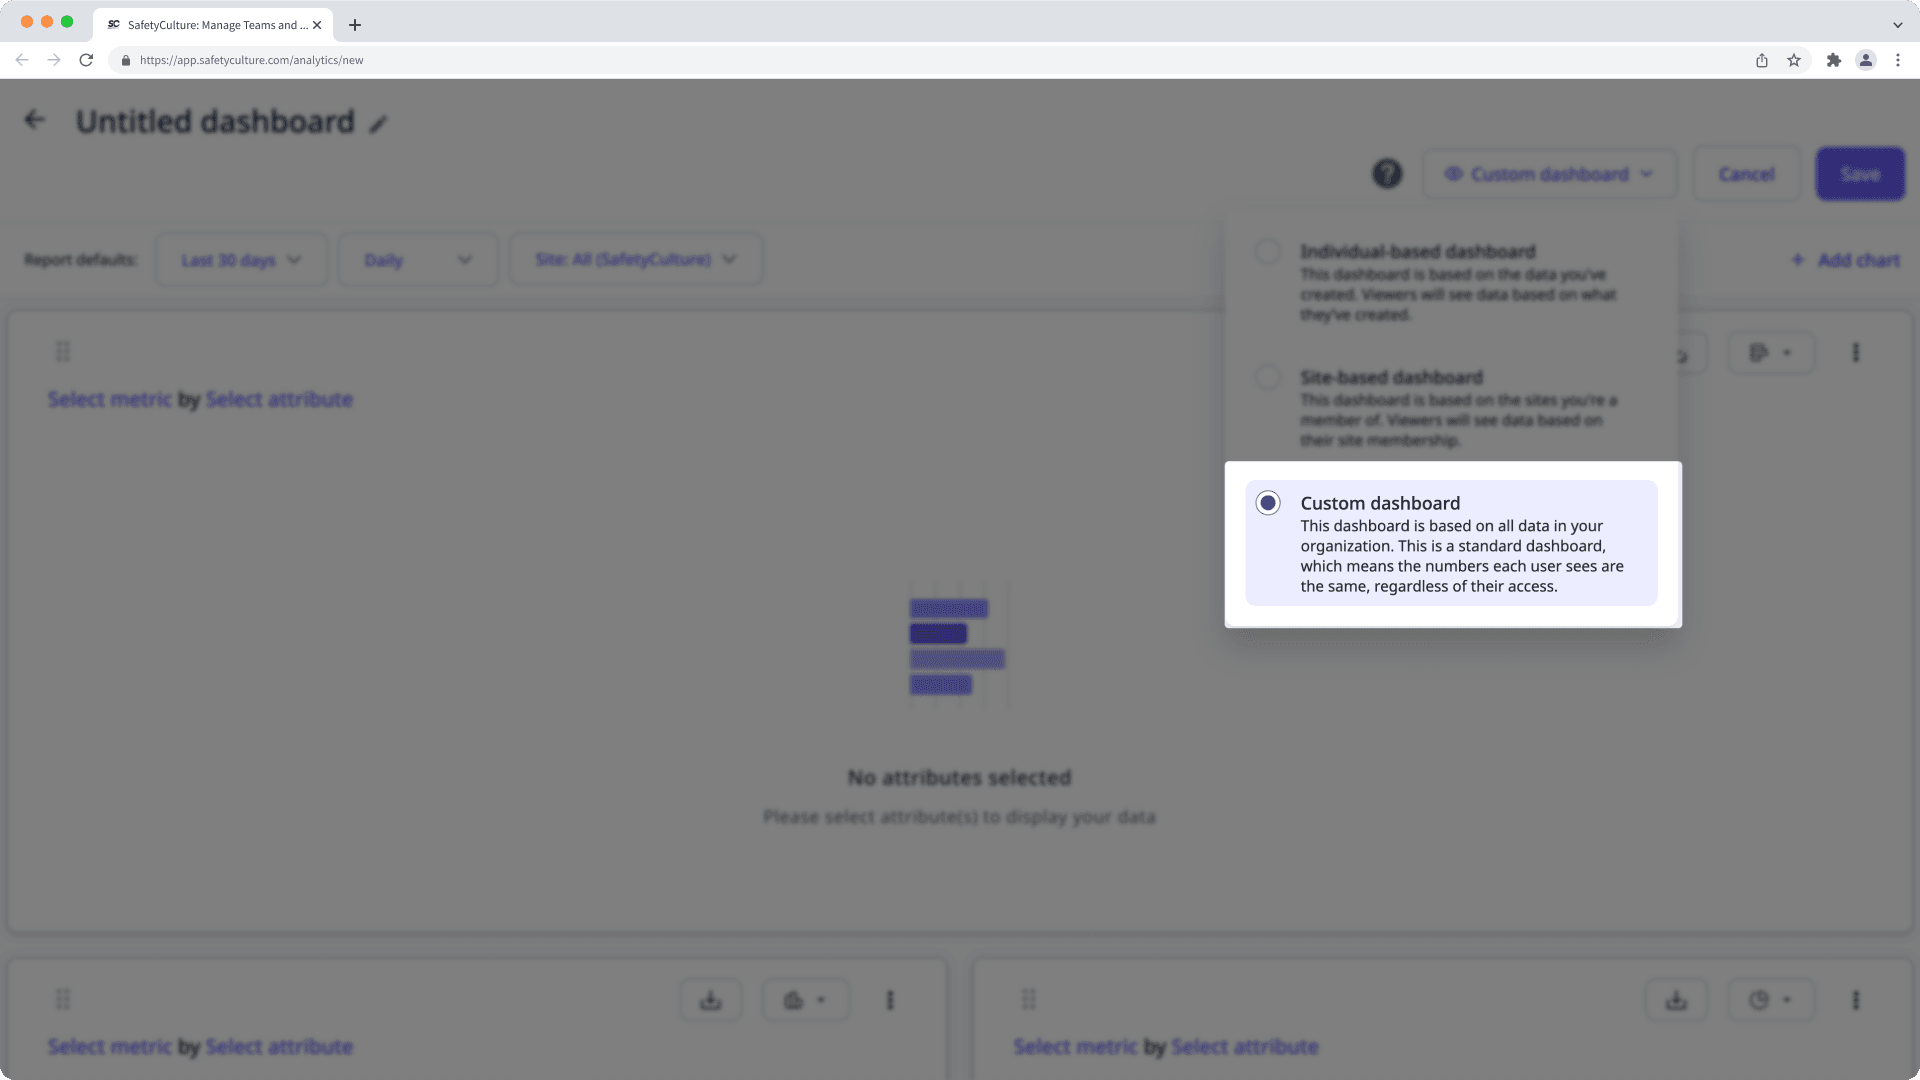
Personalizado
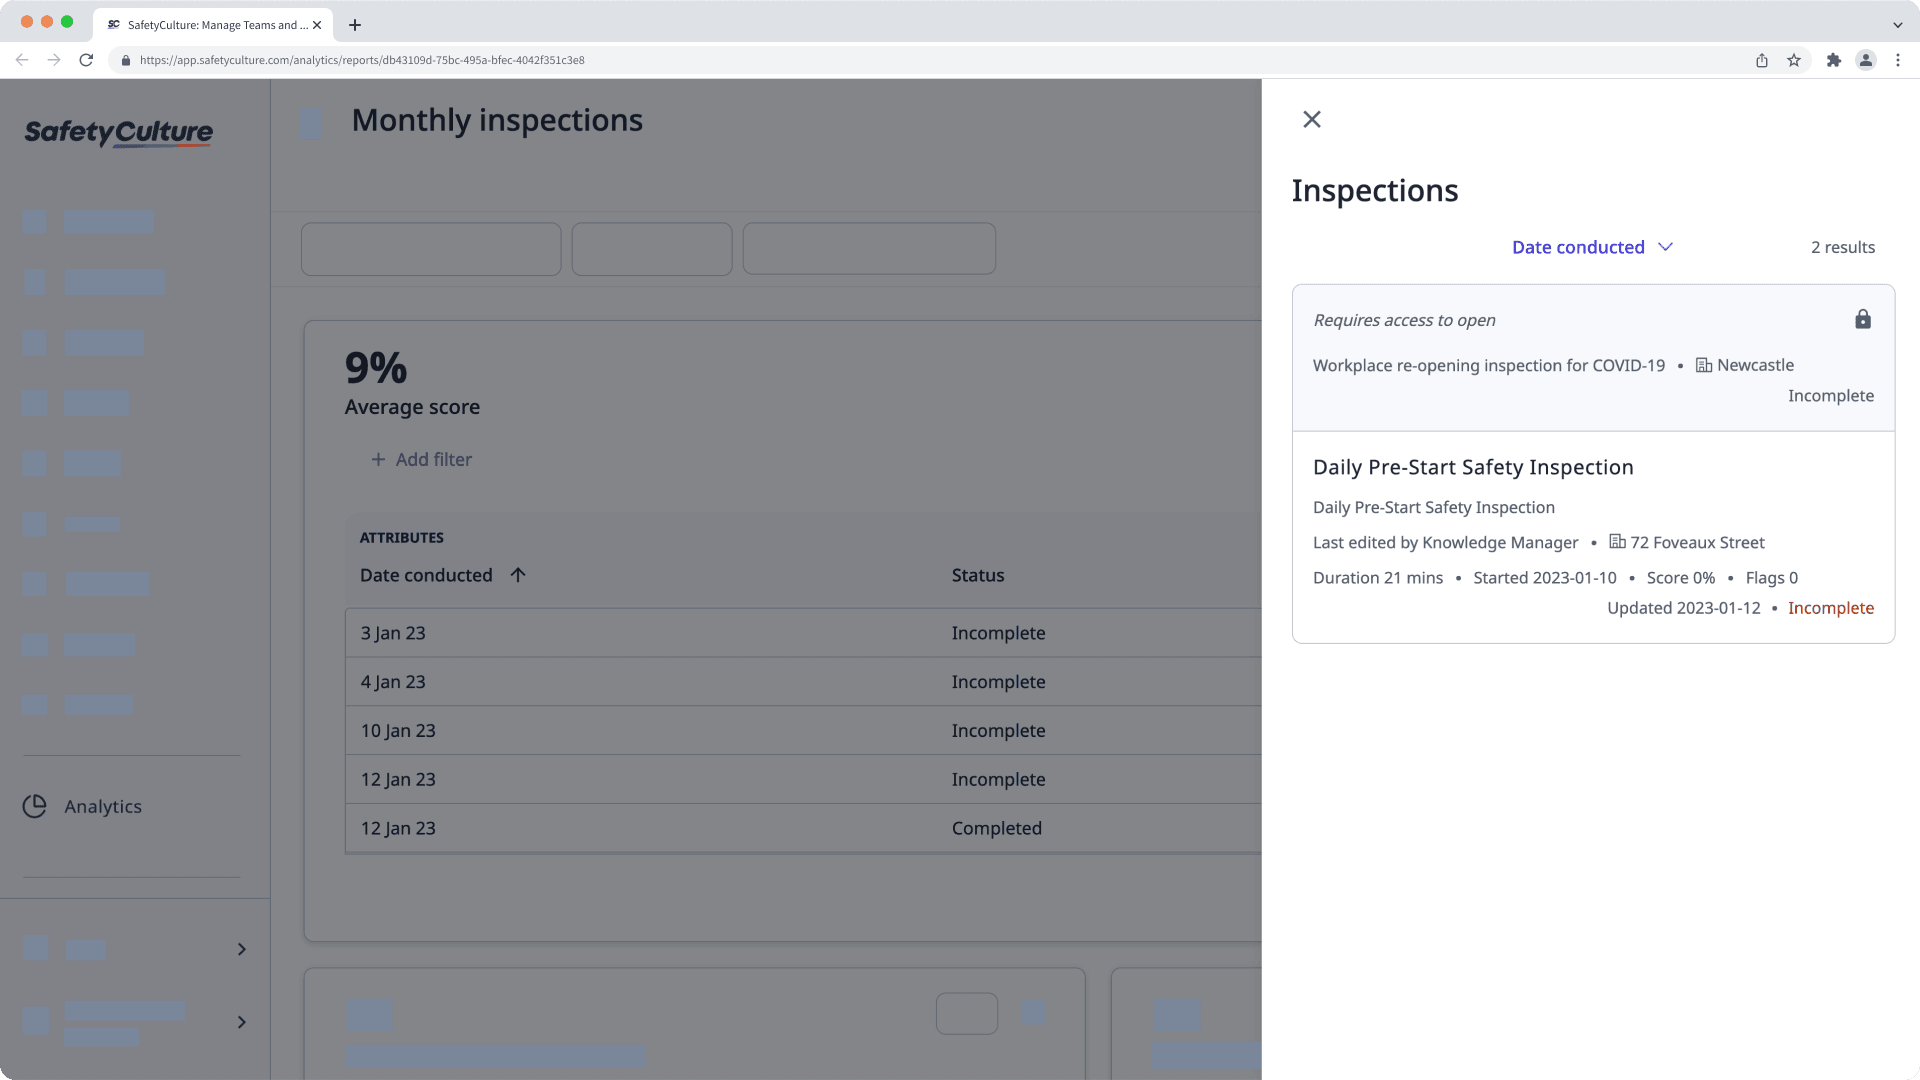
Los paneles personalizados son estáticos, lo que significa que los datos son de toda la organización y lo que cada usuario ve a nivel del panel es lo mismo. Sin embargo, si un usuario quiere profundizar en datos específicos, aquello que puede ver se basa en su acceso.

Por ejemplo, si Juan crea un panel personalizado, los datos que ve cuando añade gráficos y aplica filtros son de toda la organización. Cuando comparta el panel con Jimena, Jimena verá el mismo conjunto de datos. Sin embargo, si Juan o Jimena profundizan en datos específicos, solo podrán ver los detalles a los que pueden acceder.

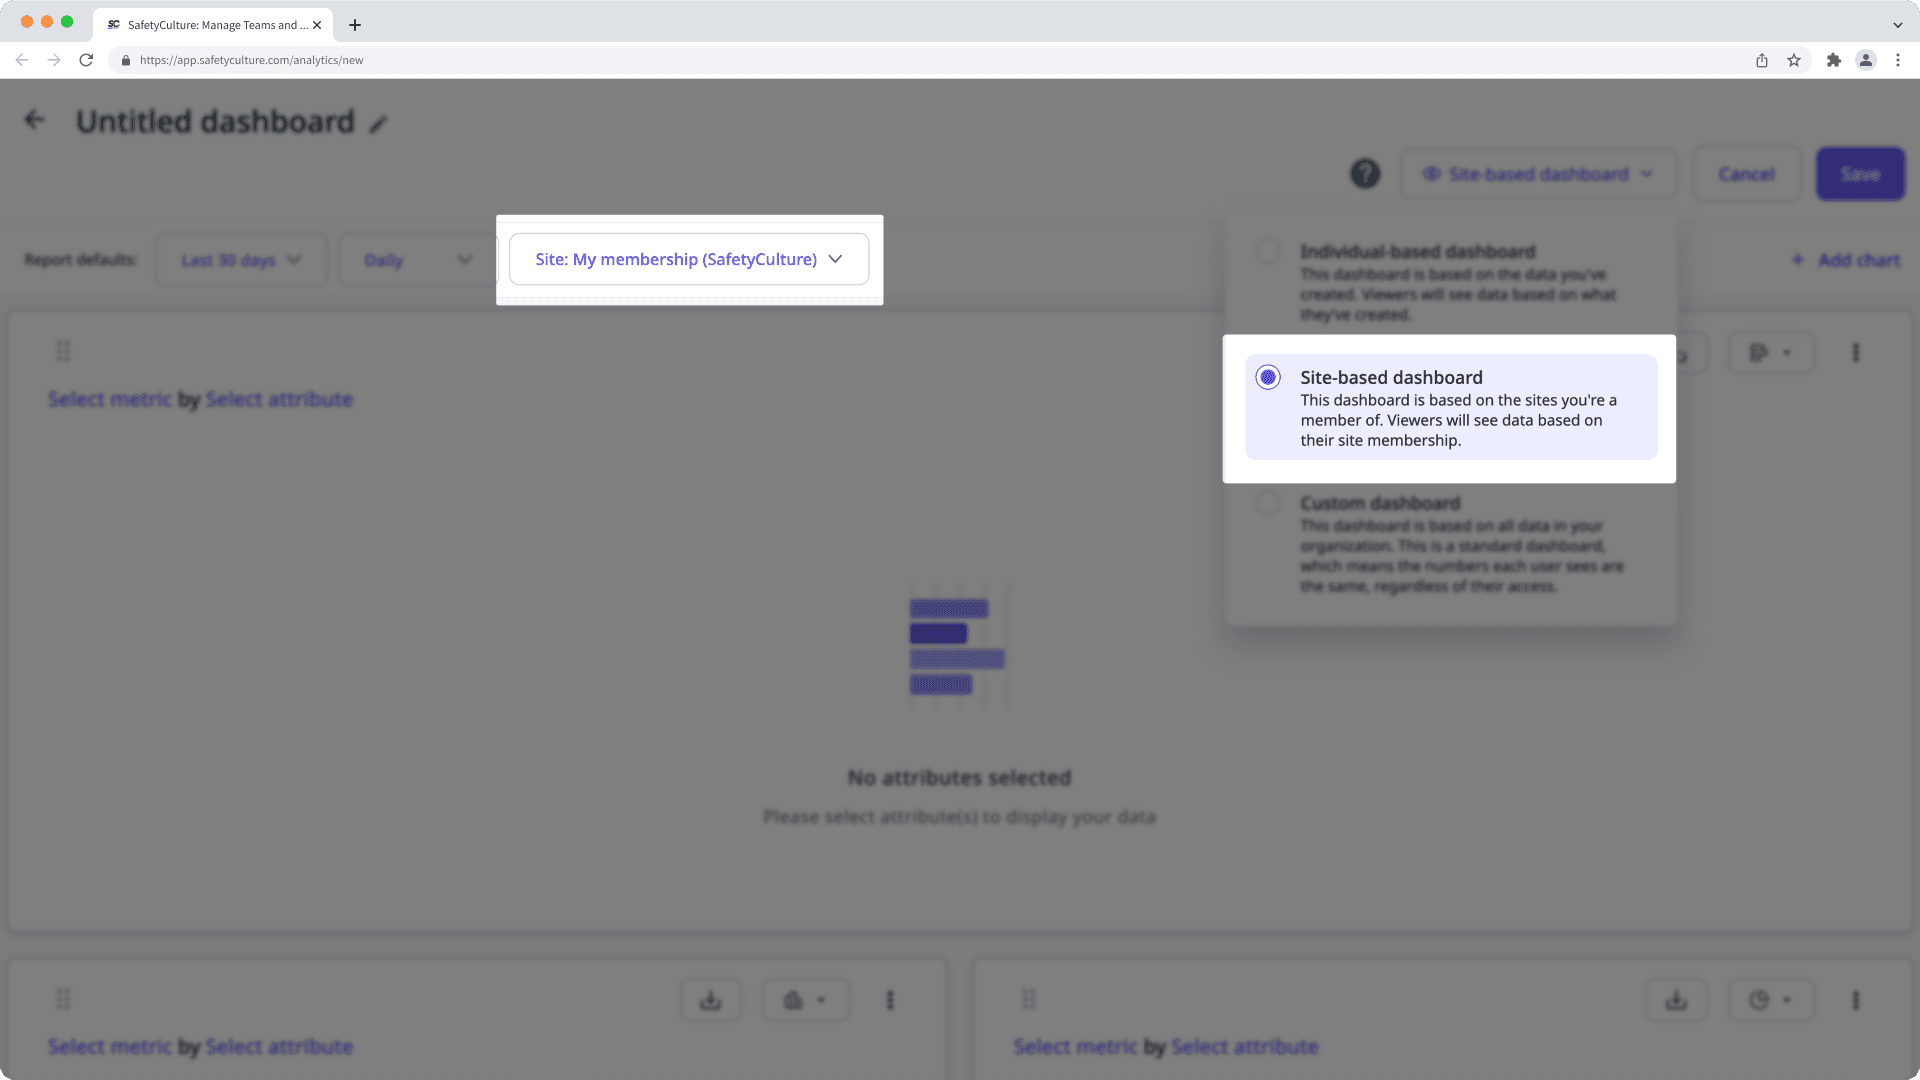
Basado en el sitio
Los paneles basados en sitios son dinámicos, lo que significa que los datos que ve cada usuario son diferentes, ya que se basan en los datos asociados con los sitios de los que son miembros.

Por ejemplo, si Juan crea un panel basado en sitios, el filtro de "Afiliación al sitio" se activará y solo verá inspecciones, acciones, etc., asociadas con los sitios de los que es miembro. Cuando comparte el panel con Jimena, Jimena puede ver un conjunto diferente de datos en función de las inspecciones, acciones, etc., asociados con los sitios de los que es miembro.
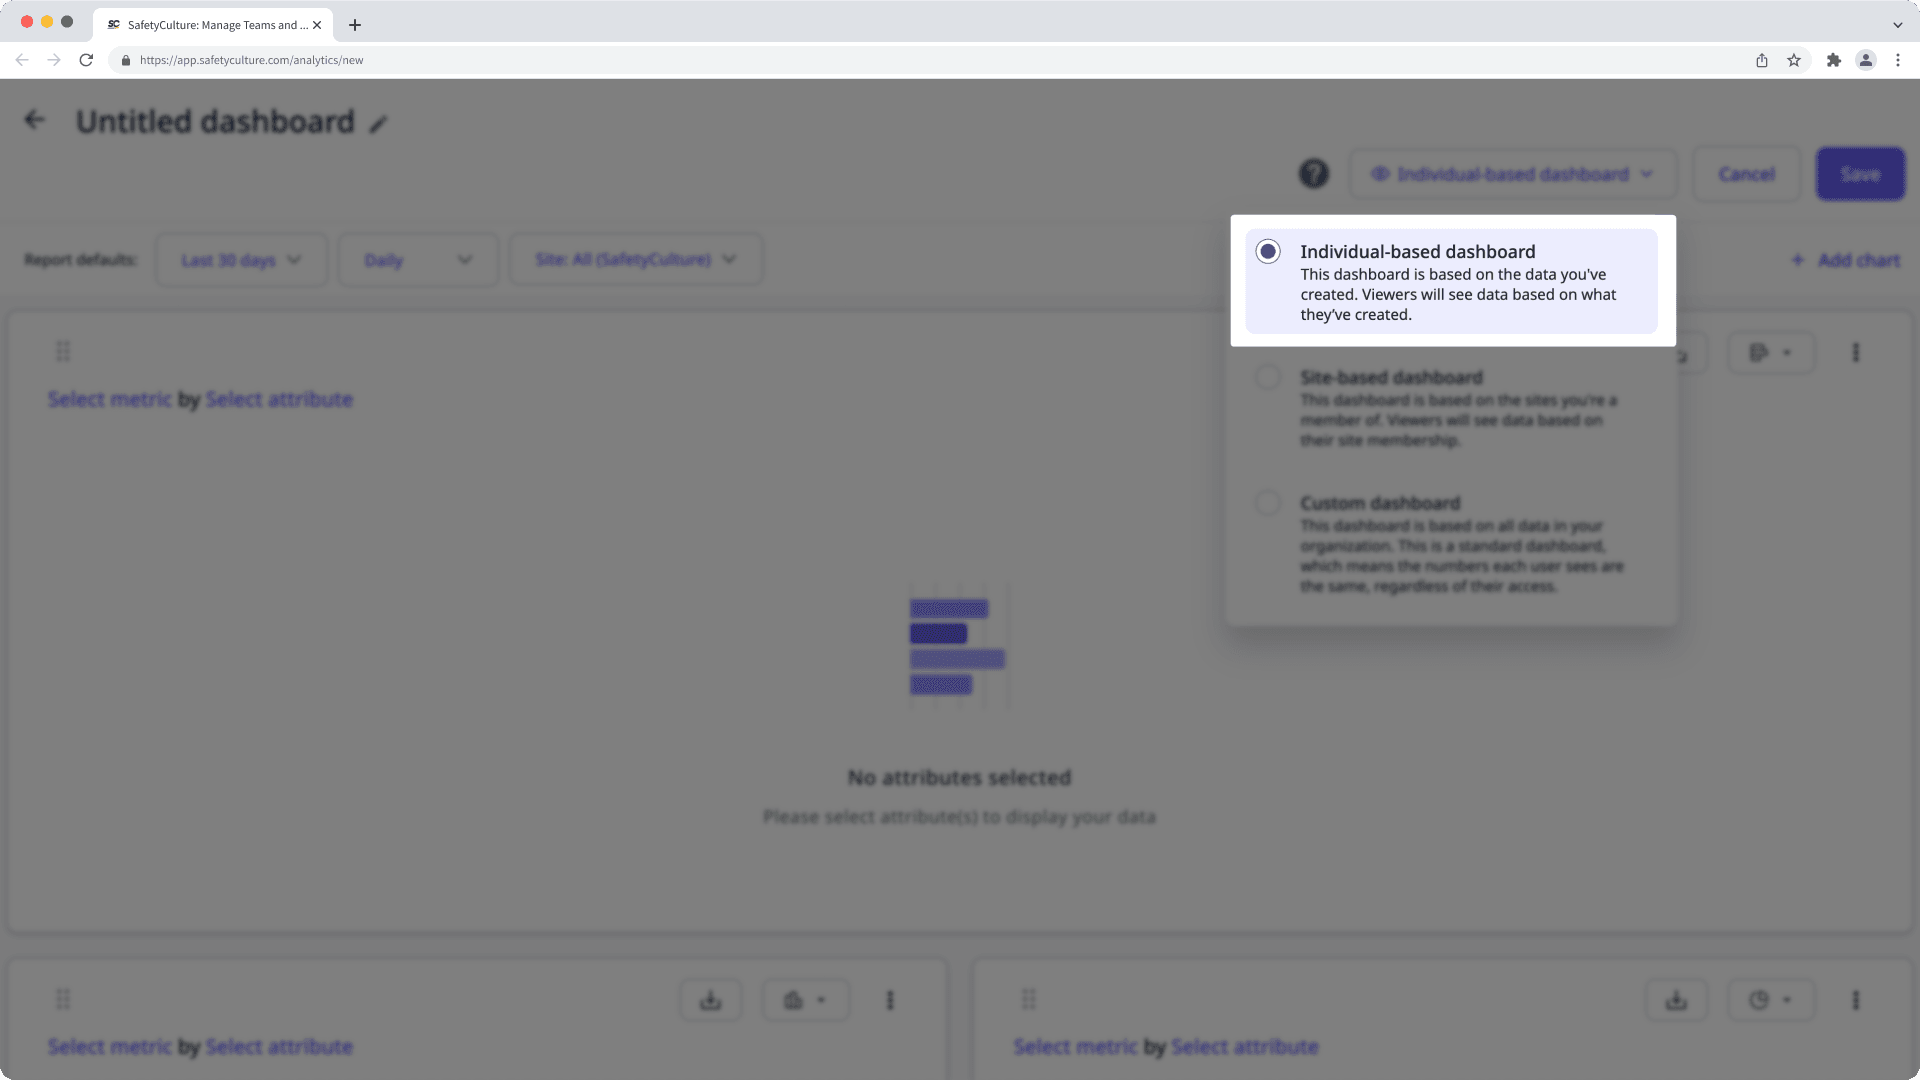
Basado en la persona
Los paneles individuales son dinámicos, lo que significa que los datos que ve cada usuario son diferentes, ya que se basan en lo que cada usuario ha creado.

Por ejemplo, si Juan crea un panel individual, solo verá las inspecciones, acciones, etc., que él haya creado. Cuando comparta el panel con Jimena, Jimena verá un conjunto diferente de datos en función de las inspecciones, acciones, etc., que ella haya creado.
En función del tipo de panel que quiera crear, necesitará el permiso correspondiente:
Panel personalizado: permiso "Estadísticas: Gestionar"
Panel basado en el sitio: permiso "Estadísticas: Crear panel (basado en el sitio)"
Panel basado en la persona: permiso "Estadísticas: Crear panel (basado en la persona)"
Varios gráficos
Añadir varios gráficos a su panel de Estadísticas permite a su equipo ver fácilmente información de diferentes fuentes de datos, identificar tendencias y comparar métricas, todo en un único panel integrado.
Filtros de panel
Filtre su panel de estadísticas para enfocarse en los datos más importantes para su organización. Establezca un rango de fechas personalizado, seleccione los sitios relevantes y elija grupos específicos para filtrar sus datos y visualizar tendencias.
Compartir paneles
Una vez que haya personalizado su panel de Estadísticas, puede compartirlo con grupos específicos o conceder acceso a toda su organización. Esta función le permite controlar el acceso según roles o necesidades específicas, asegurando que los datos relevantes solo estén disponibles para los equipos adecuados.
Personalización de paneles
Dado que los gráficos a veces ocupan demasiado espacio en la pantalla, tiene la posibilidad de redimensionar sus gráficos de Estadísticas fácilmente para ver y analizar datos rápidamente. Optimice su panel ajustando el tamaño de los gráficos y personalizando la visibilidad de los datos para mostrar valores cero u ocultar los totales de las métricas. De esta forma, su equipo podrá centrarse en la información más relevante de un solo vistazo.
¿Esta página le fue de ayuda?
Gracias por hacérnoslo saber.