Ce dont vous aurez besoin
Configurer la métrique et l'attribut d'un graphique
Select Données analytiques in the sidebar or select it in Plus.
Click on the upper-right corner of the chart.
Click the dropdown menu under “Metric” and select the metric depending on the type of data you want to report on.
If you're creating a new chart, click Sélectionner la métrique to add one.
Click the dropdown menu under "Attribute" to select the relevant attribute for your metric.
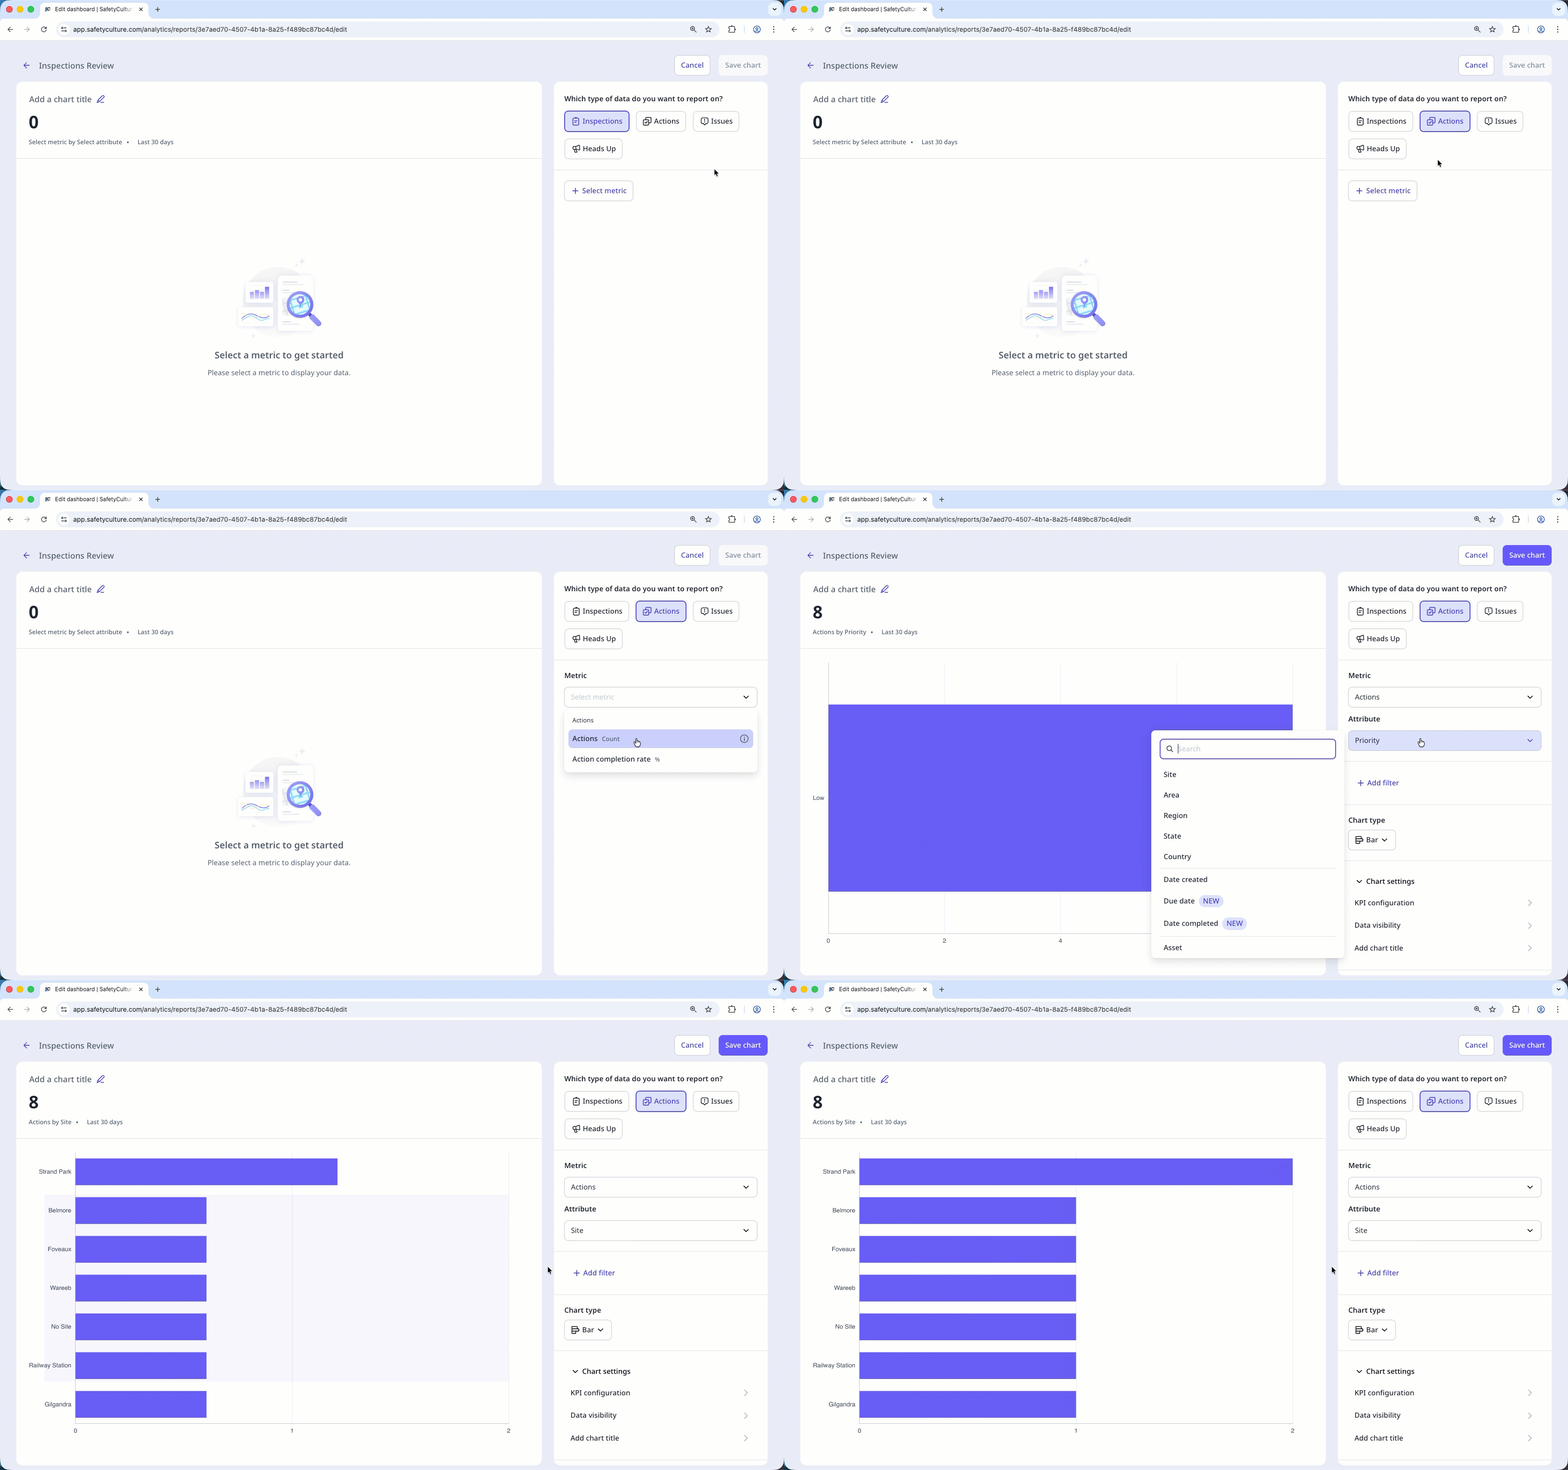
Click Enregistrer le graphique on the upper-right of the page to save the changes to the chart.
Click Enregistrer on the upper-right of the page to save the changes to your dashboard.
La sélection de mesures sous différents types de données n'est actuellement pas supportée pour les graphiques à deux axes. Par exemple, seules les mesures du jeu de données Inspections peuvent être utilisées dans un graphique à deux axes.