- Utiliser SafetyCulture
- Capteurs
- Afficher les relevés des capteurs
Afficher les relevés des capteurs
Apprenez à afficher les relevés des capteurs à partir de l'application Web ou de l'application portable.Afficher les relevés d'un capteur
Sélectionnez
Capteurs dans la barre latérale ou sélectionnez-le dans
Plus.
Sélectionnez Capteurs dans l'onglet situé en haut de la page.
Cliquez sur le capteur dont vous souhaitez afficher les relevés.
Sélectionnez Détails du capteur.
Sur le côté gauche, vous pouvez sélectionner « Température » et « Humidité » en fonction du relevé.
Cliquez sur le sélecteur de date à droite et sélectionnez l'une des options suivantes :
Plus de 4 heures
Dernières 24 heures
Derniers 7 jours
Derniers 28 jours
Plage personnalisée
Votre graphique affichera des relevés basés sur la période sélectionnée.
Pour les 4 ou 24 dernières heures, le graphique affiche les relevés du capteur par intervalles de 10 minutes.
Pour des périodes plus longues, le graphique affichera les capteurs à différents intervalles afin de fournir un affichage plus clair des tendances du relevé.
Ouvrez l'application portable.
Appuyez sur
Plus en bas à droite de votre écran.
Sélectionnez
Capteurs dans la liste des options.
Appuyez sur Capteurs en haut de votre écran.
Appuyez sur
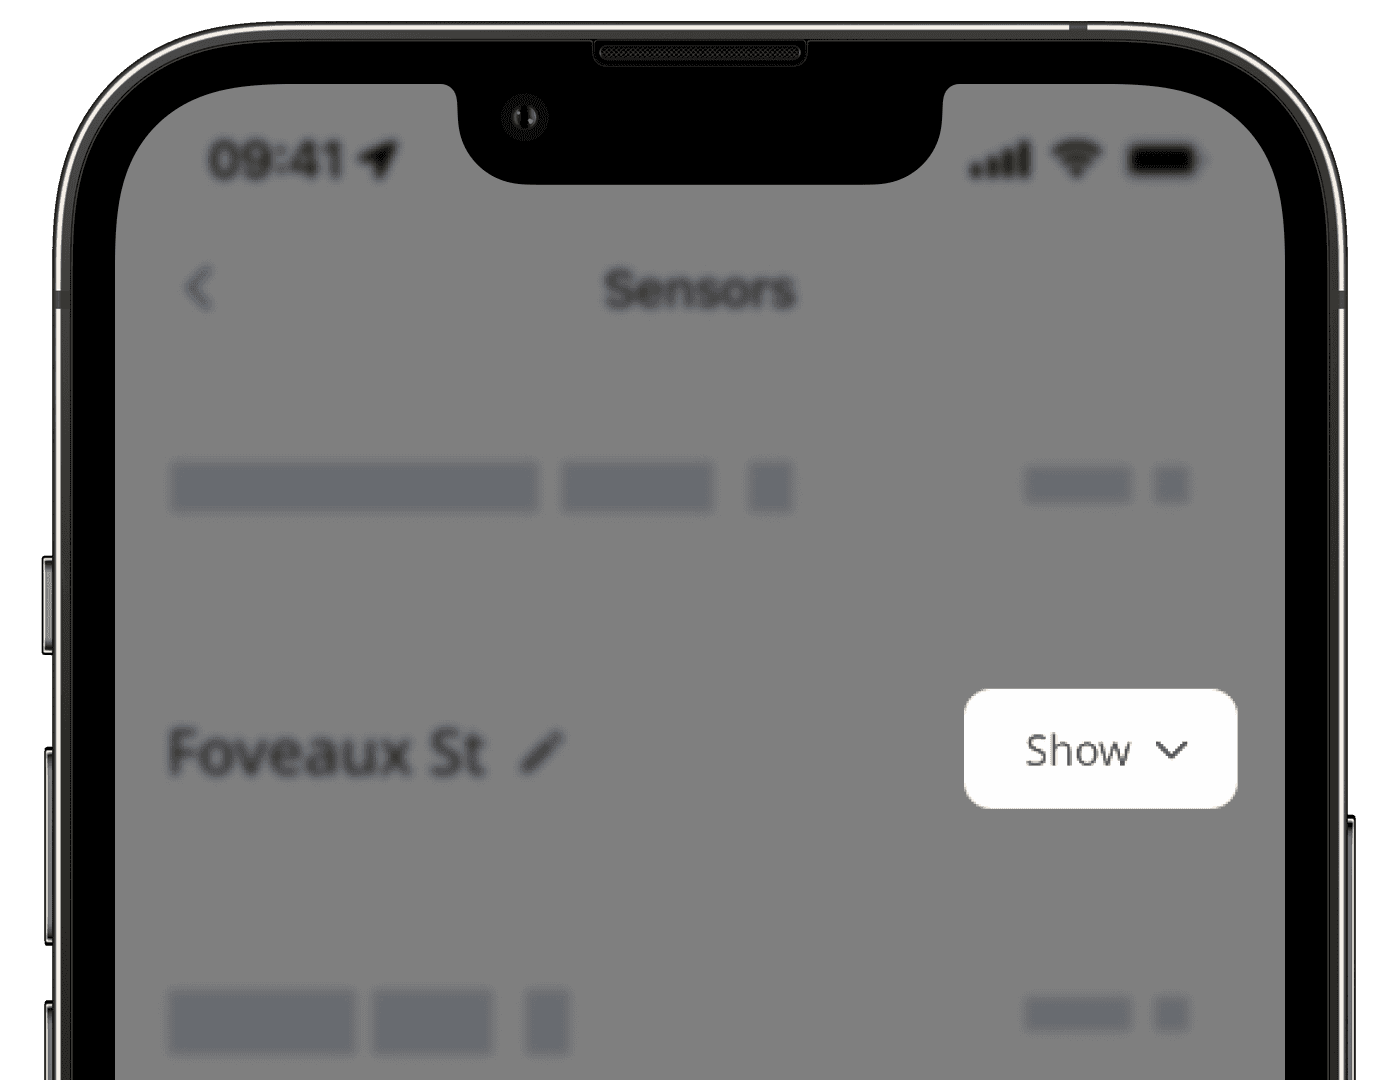
Afficher à droite de la position du capteur et sélectionnez le capteur dont vous souhaitez afficher les Capteurs.

Appuyez sur Détails du capteur.
Faites défiler jusqu'à la section graphique et configurez votre affichage en conséquence.
Vous pouvez sélectionner « Température » et « Humidité » en fonction du relevé désiré.
Appuyez sur le sélecteur de date et sélectionnez l'une des options suivantes.
Plus de 4 heures
Dernières 24 heures
Derniers 7 jours
Derniers 28 jours
Plage personnalisée
Votre graphique affichera des relevés basés sur la période de temps sélectionnée :
Pour les 4 ou 24 dernières heures, le graphique affiche les relevés du capteur par intervalles de 10 minutes.
Pour des périodes plus longues, le graphique affichera les capteurs à différents intervalles afin de fournir un affichage plus clair des tendances du relevé.
Pour accéder à tous les relevés des capteurs par intervalles de 10 minutes, téléchargez le fichier CSV des relevés de vos capteurs.
Cette page vous a-t-elle été utile?
Merci pour votre commentaire.