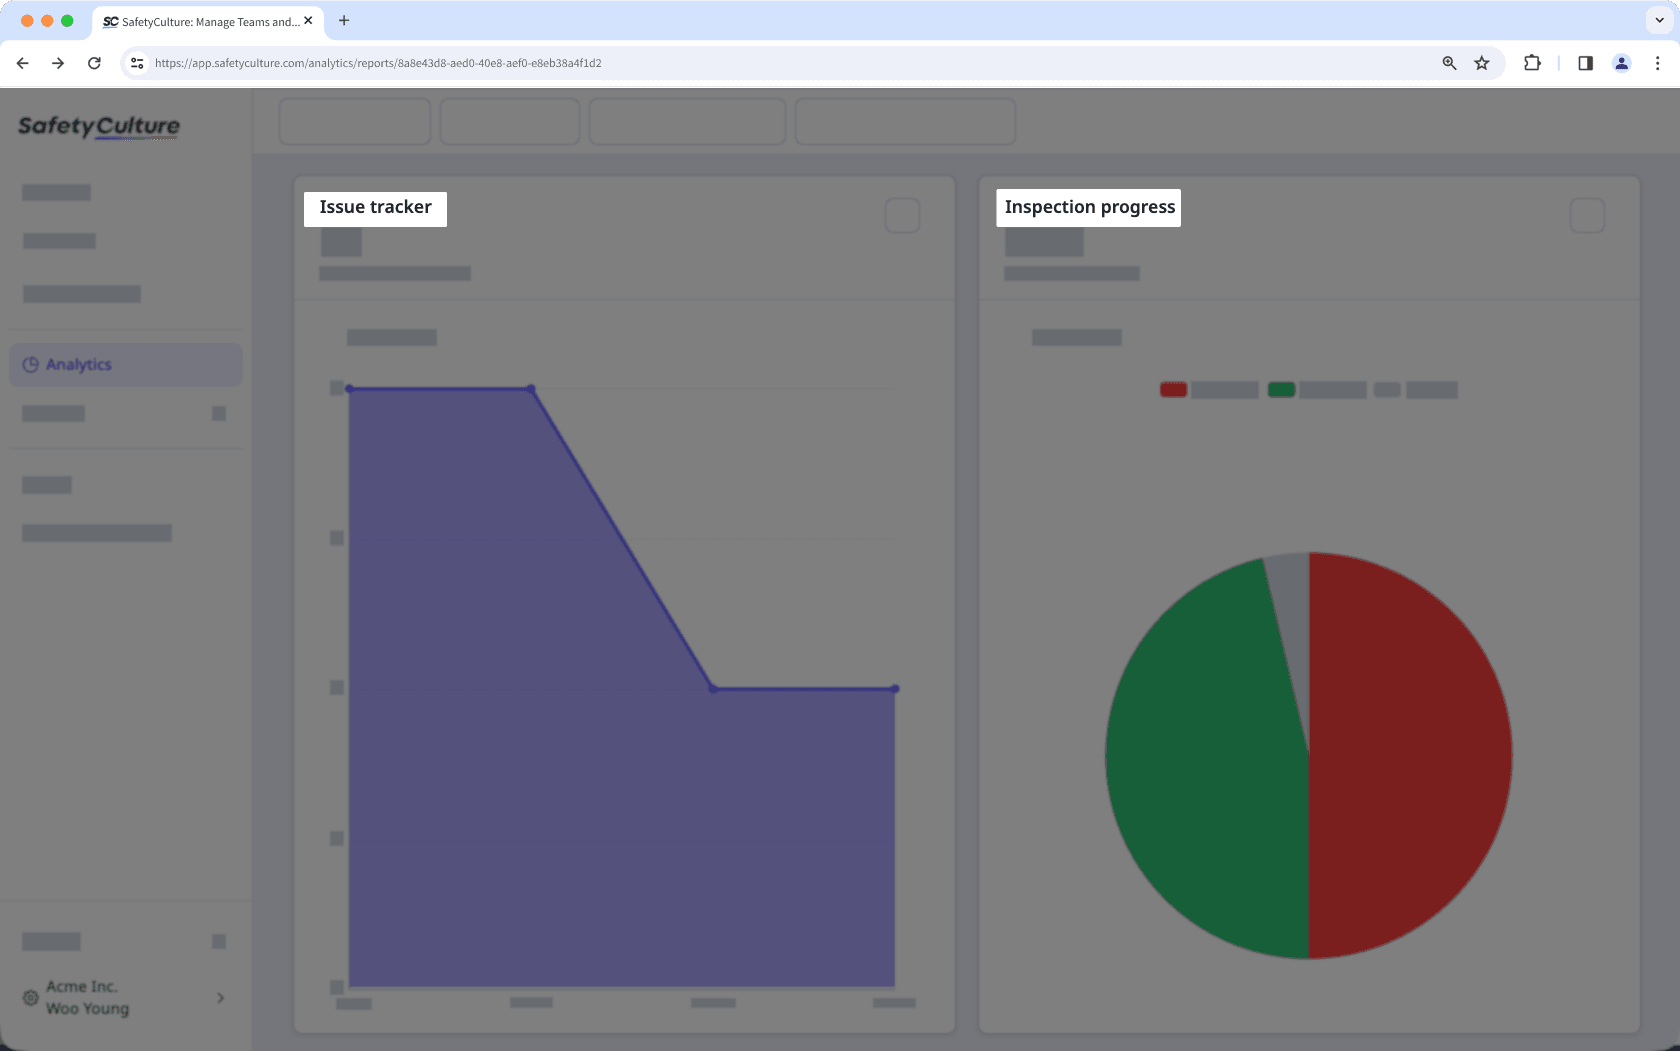
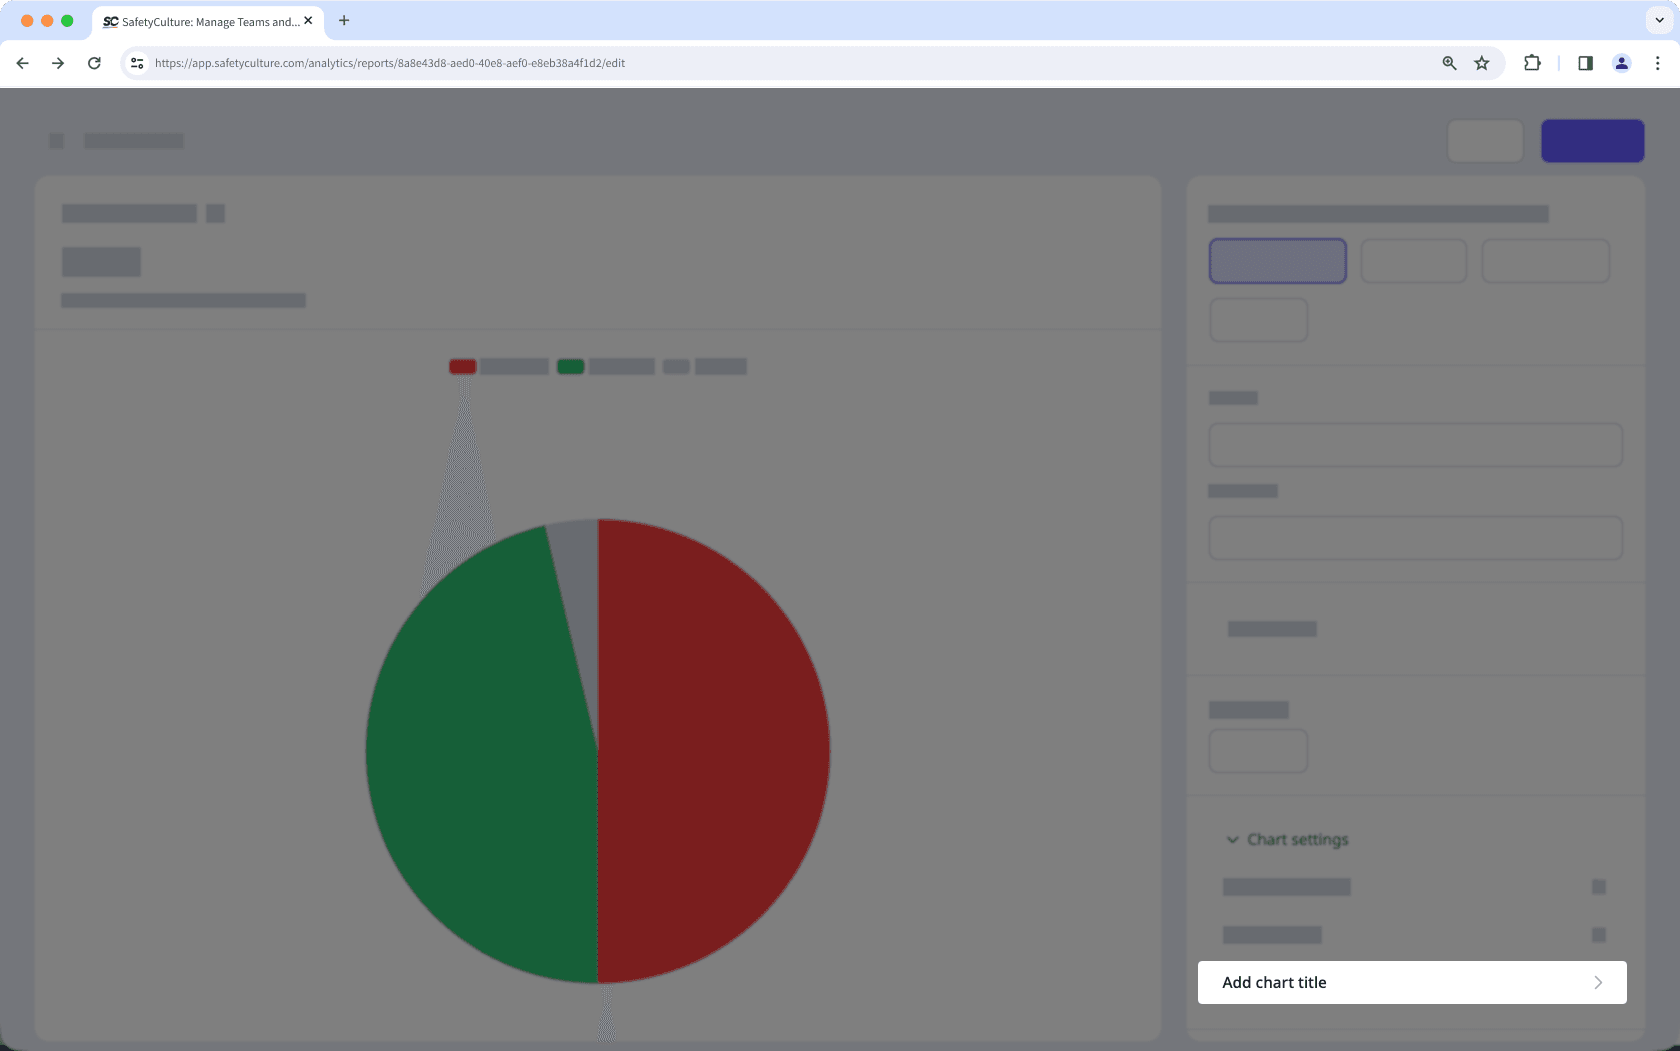
Ajouter ou modifier des titres de graphiques
Apprenez à ajouter ou modifier des titres de graphiques via l'application Web afin de fournir un contexte clair aux parties prenantes et d'améliorer la lisibilité des tableaux de bord Données analytiques complexes.Pourquoi utiliser les titres des graphiques ?
Les titres des graphiques sont des étiquettes personnalisables pour les graphiques dans les Tableaux de bord analytiques qui aident à décrire ce que chaque graphique représente. À mesure que votre organisation suit davantage de données et ajoute davantage de graphiques, les titres facilitent l'organisation des tableaux de bord complexes et permettent de différencier clairement les métriques similaires, ce qui est particulièrement utile dans les cas suivants :
Examen de tableaux de bord complexes comportant plusieurs points de données.
Partager des tableaux de bord avec les membres de l'équipe.
Collaborer avec des parties prenantes qui ne sont peut-être pas familiarisées avec la configuration des données.
Des titres de graphiques clairs réduisent le risque d'interprétation erronée des données lors des révisions et garantissent une compréhension immédiate des informations. Vous pouvez par exemple utiliser des titres pour distinguer les graphiques « Inspections par site » et « Inspections par modèle », ce qui aide les équipes à analyser les tendances en toute confiance et à prendre plus rapidement des décisions éclairées.

Ajouter un titre de graphique
Sélectionnez
Données analytiques dans la barre latérale ou sélectionnez-le dans
Plus.
Cliquez sur Enregistrer en haut à droite de la page.
Cliquez sur Paramètres des graphiques, puis sélectionnez Configuration KPI.

Cliquez sur Enregistrer le graphique en haut à droite de la page.
Cliquez sur Enregistrer en haut à droite de la page.
Modifier le titre d'un graphique
Sélectionnez
Données analytiques dans la barre latérale ou sélectionnez-le dans
Plus.
Cliquez sur Enregistrer en haut à droite de la page.
Cliquez sur
en haut à gauche du graphique, puis appuyez sur entrer ou retour sur votre clavier ou cliquez n'importe où dans le générateur de graphiques.
Cliquez sur Enregistrer le graphique en haut à droite de la page.
Cliquez sur Enregistrer en haut à droite de la page.
Cette page vous a-t-elle été utile?
Merci pour votre commentaire.