Cambiar los tipos de gráficos
Aprenda a cambiar los tipos de gráficos en sus paneles a través de la aplicación web.¿Qué tipos de gráficos hay disponibles?
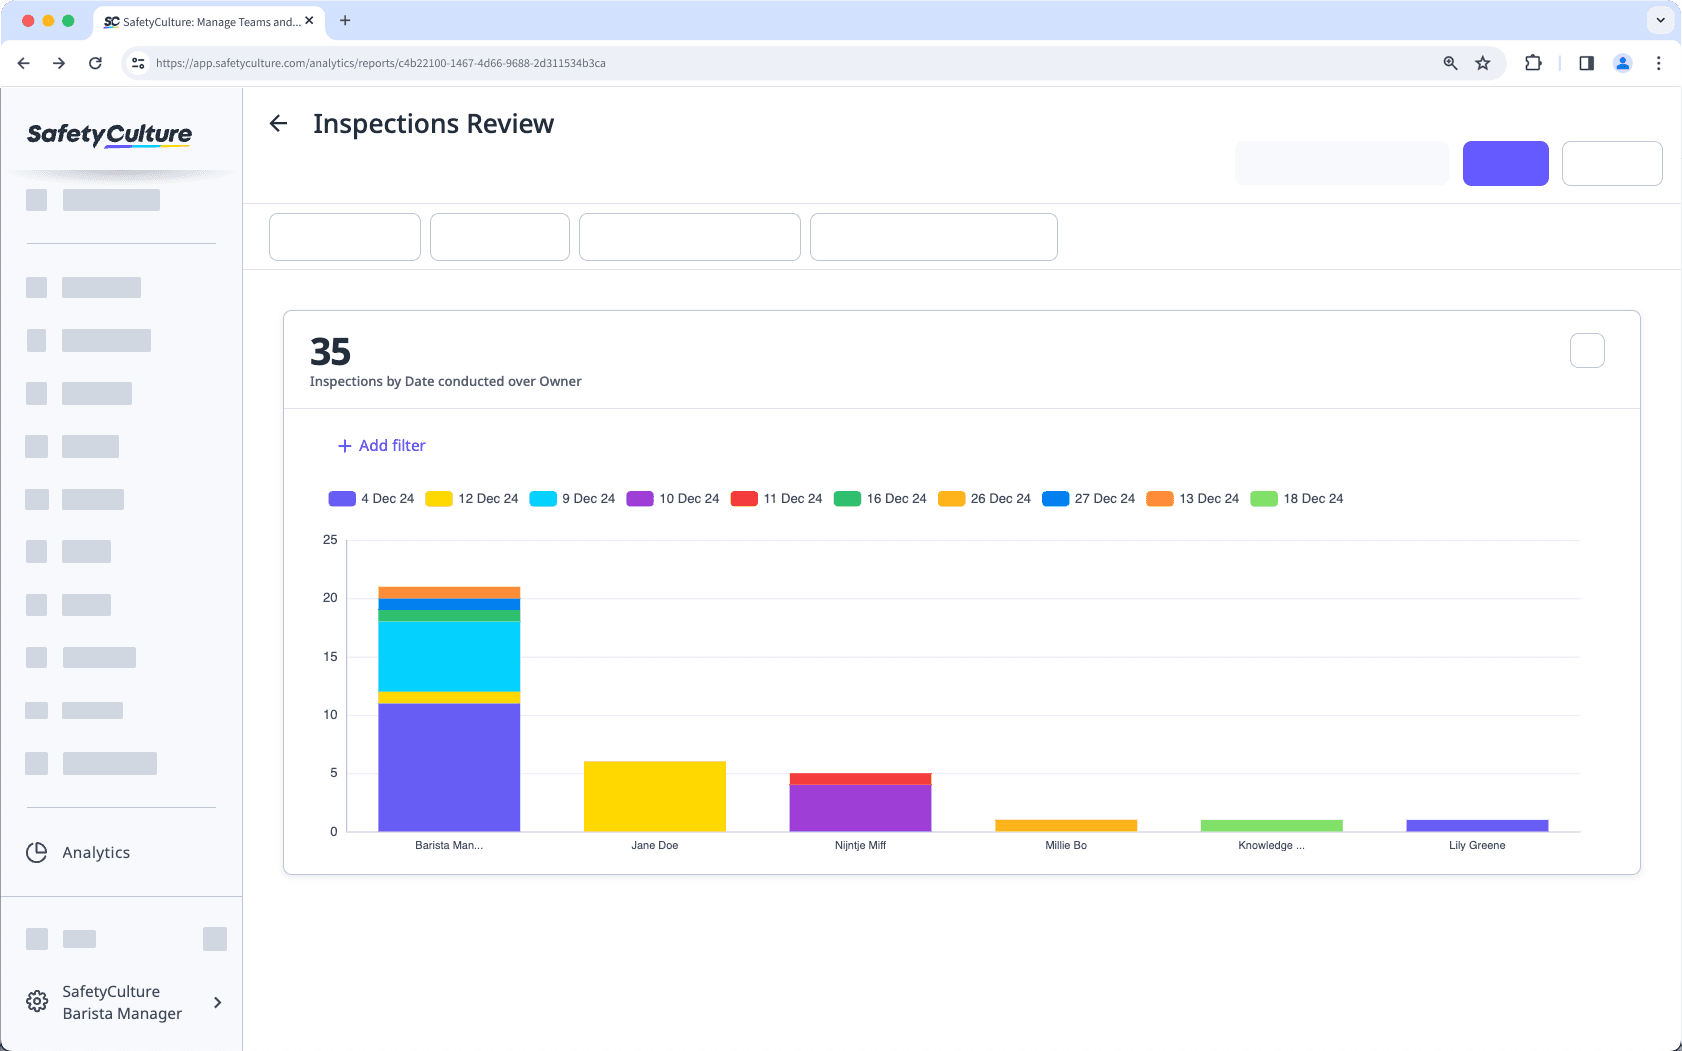
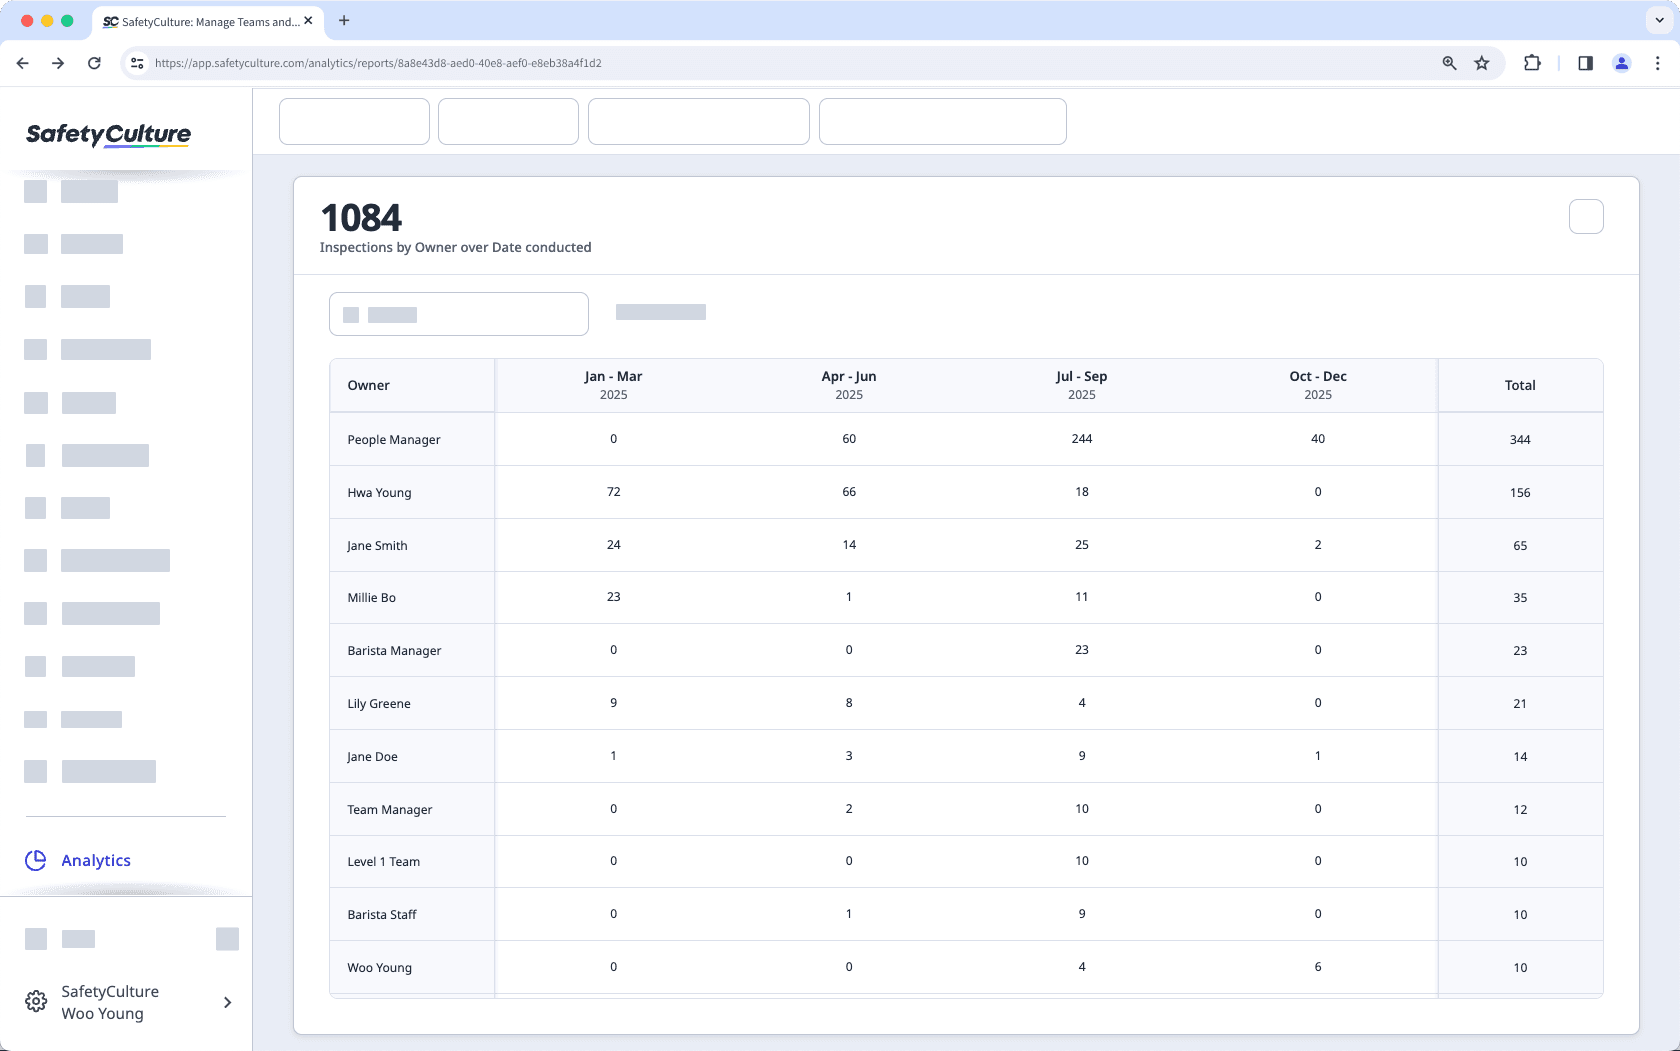
Este tipo de gráfico le permite comparar datos según dos atributos diferentes. Por ejemplo, puede ver la cantidad de inspecciones por fecha de realización y propietario.
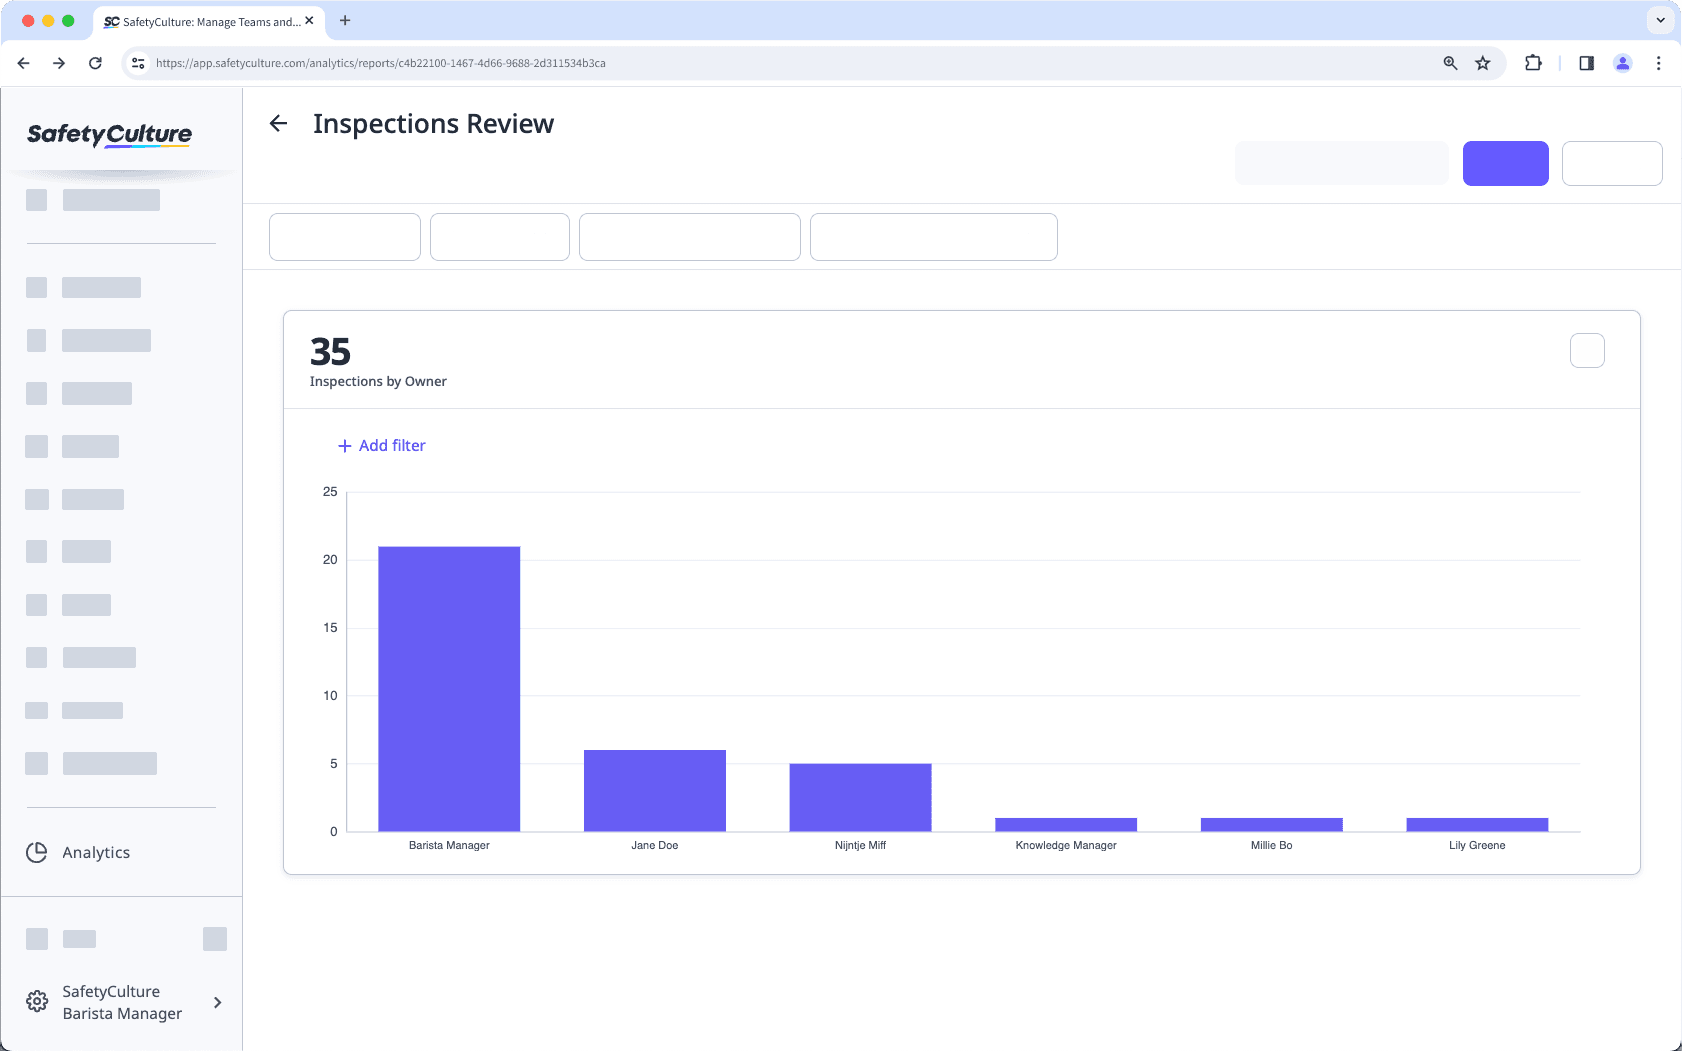
Este tipo de gráfico le permite ver sus datos de manera vertical, con una métrica por atributo. Por ejemplo, puede ver la cantidad de inspecciones por propietario.
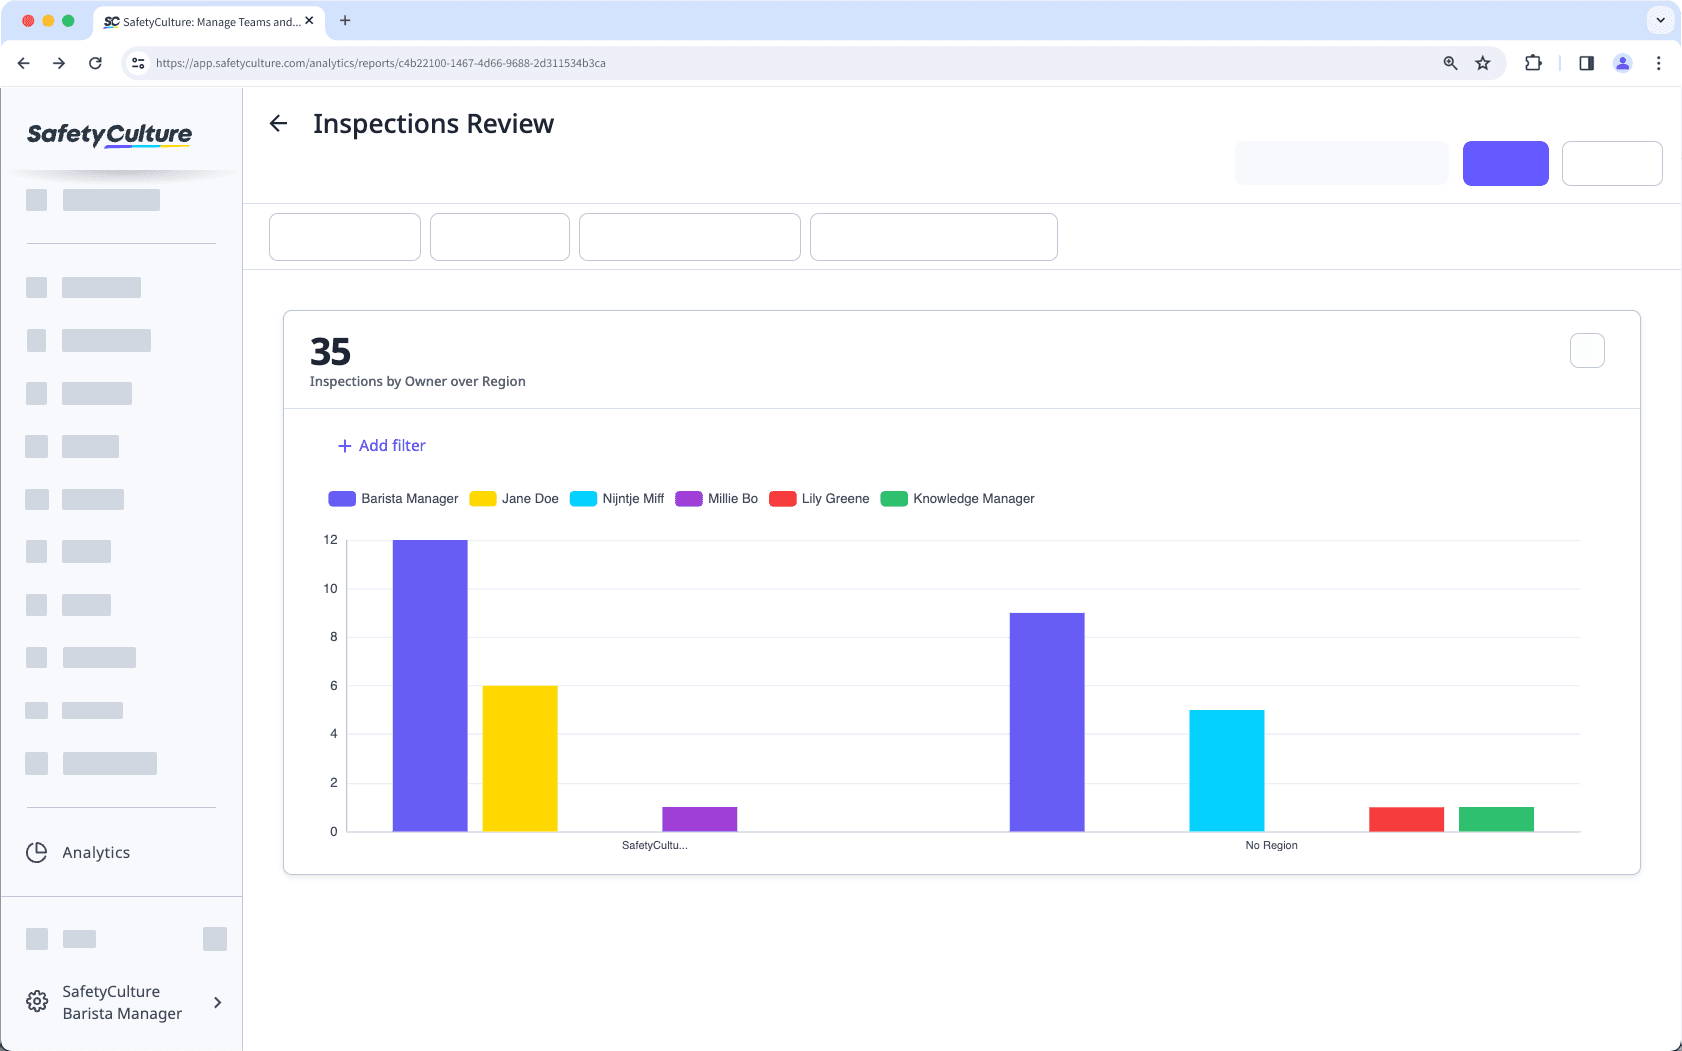
Este tipo de gráfico le permite comparar datos según dos atributos diferentes. Por ejemplo, puede ver la cantidad de inspecciones por región y por propietario.
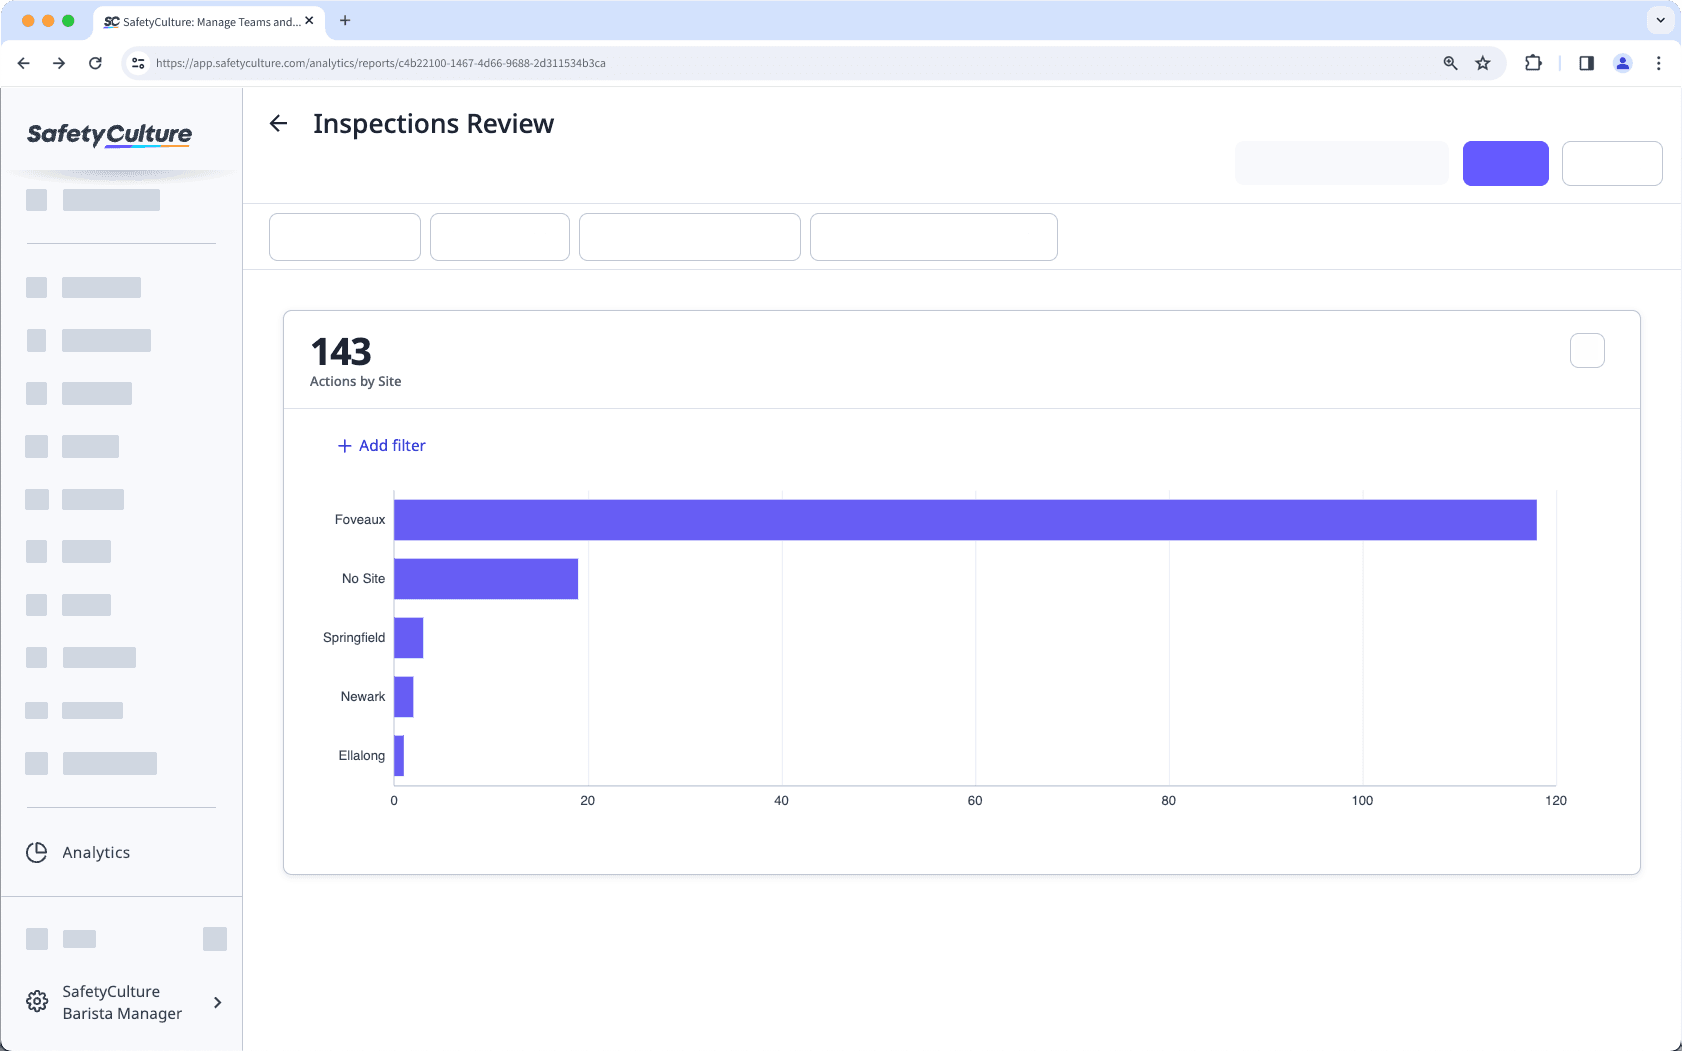
Este tipo de gráfico le permite ver sus datos de manera horizontal, con una métrica por atributo. Por ejemplo, puede ver la cantidad de acciones por sitio.
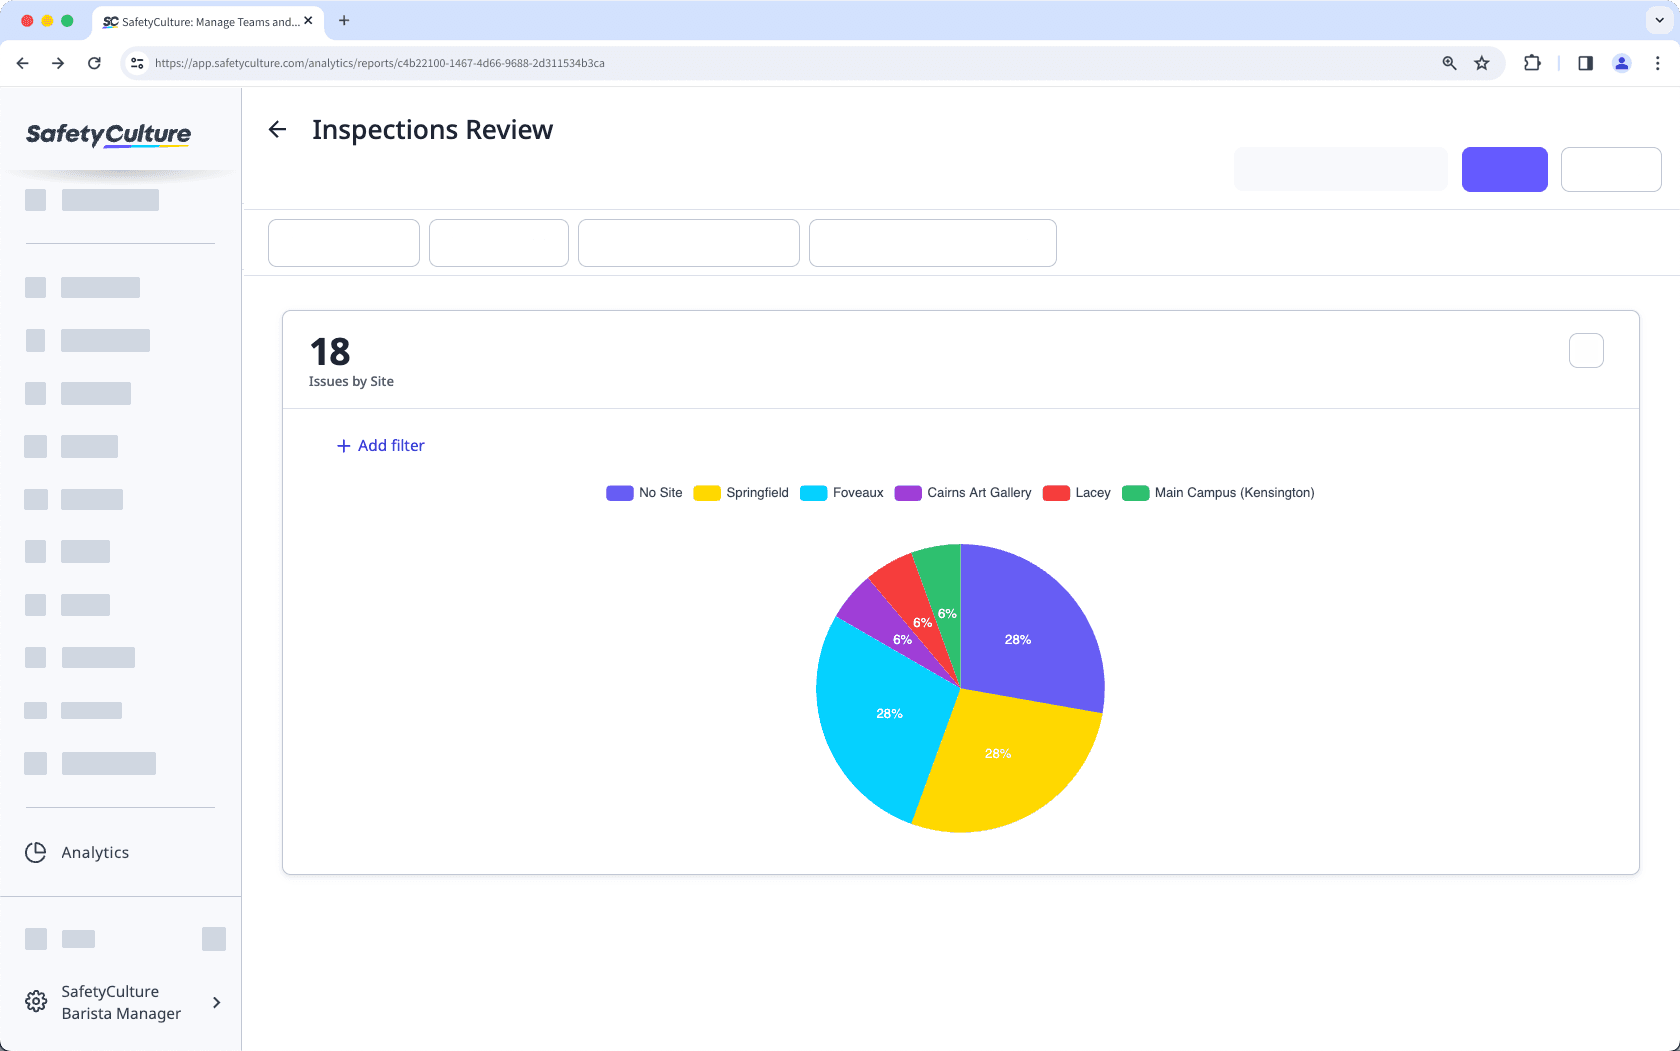
Este tipo de gráfico le permite ilustrar las secciones de sus datos a través de un porcentaje por sección representada, según el atributo que haya seleccionado. Por ejemplo, puede ver las proporciones de los contratiempos creados por sitio.
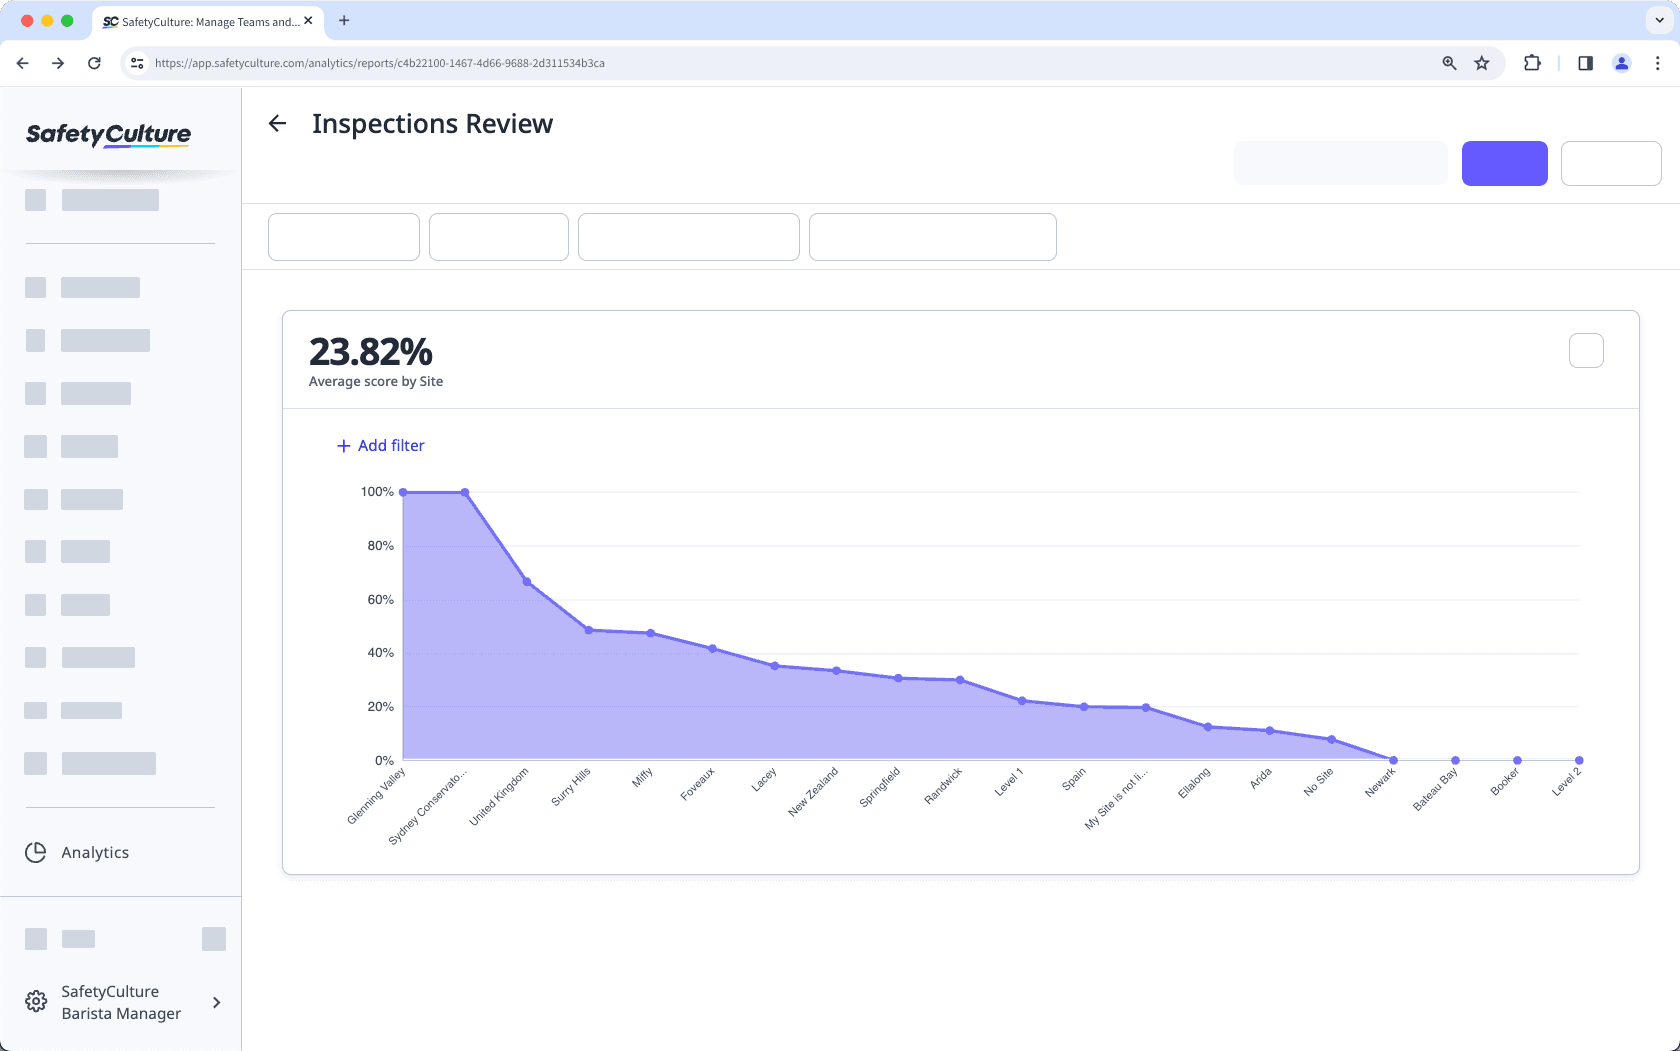
Este tipo de gráfico le permite ver los cambios de valor a lo largo de un eje horizontal. Por ejemplo, puede ver el rendimiento de su equipo a través de la puntuación promedio de las inspecciones por sitio.
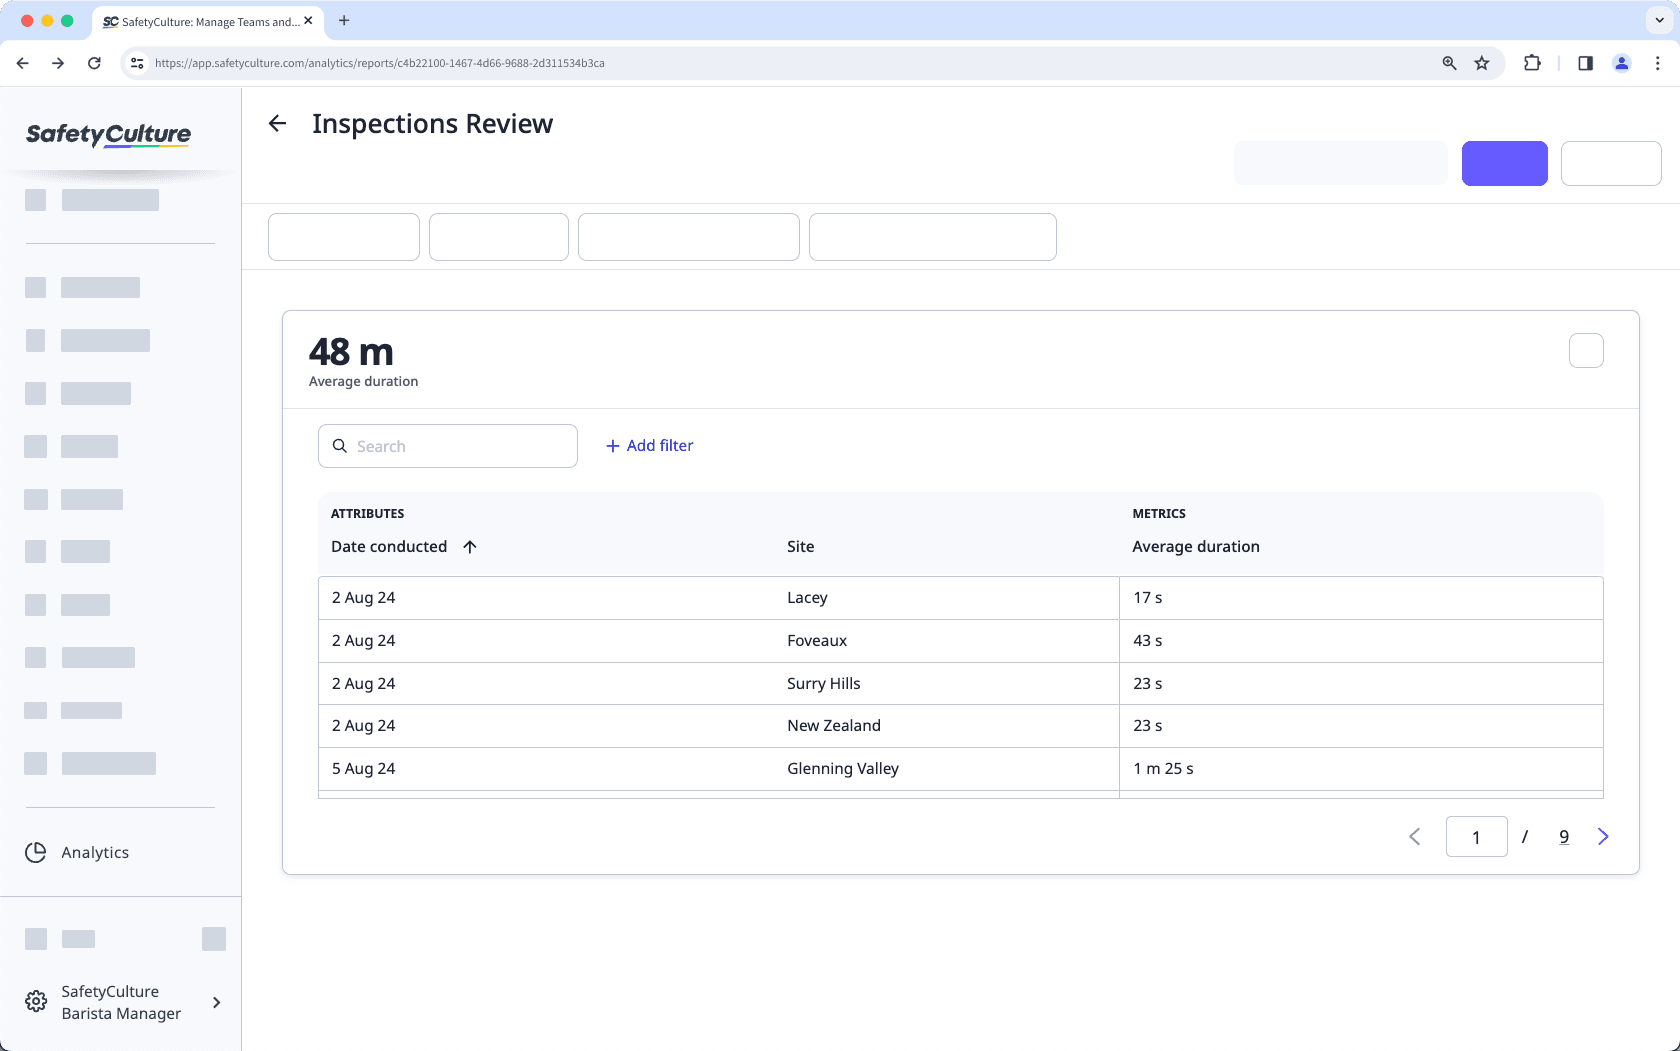
Este tipo de gráfico le permite organizar los datos en filas y columnas seleccionando dos atributos. Por ejemplo, puede ver la duración promedio de las inspecciones en función de la fecha y el sitio en que se realizaron en un formato tabular.
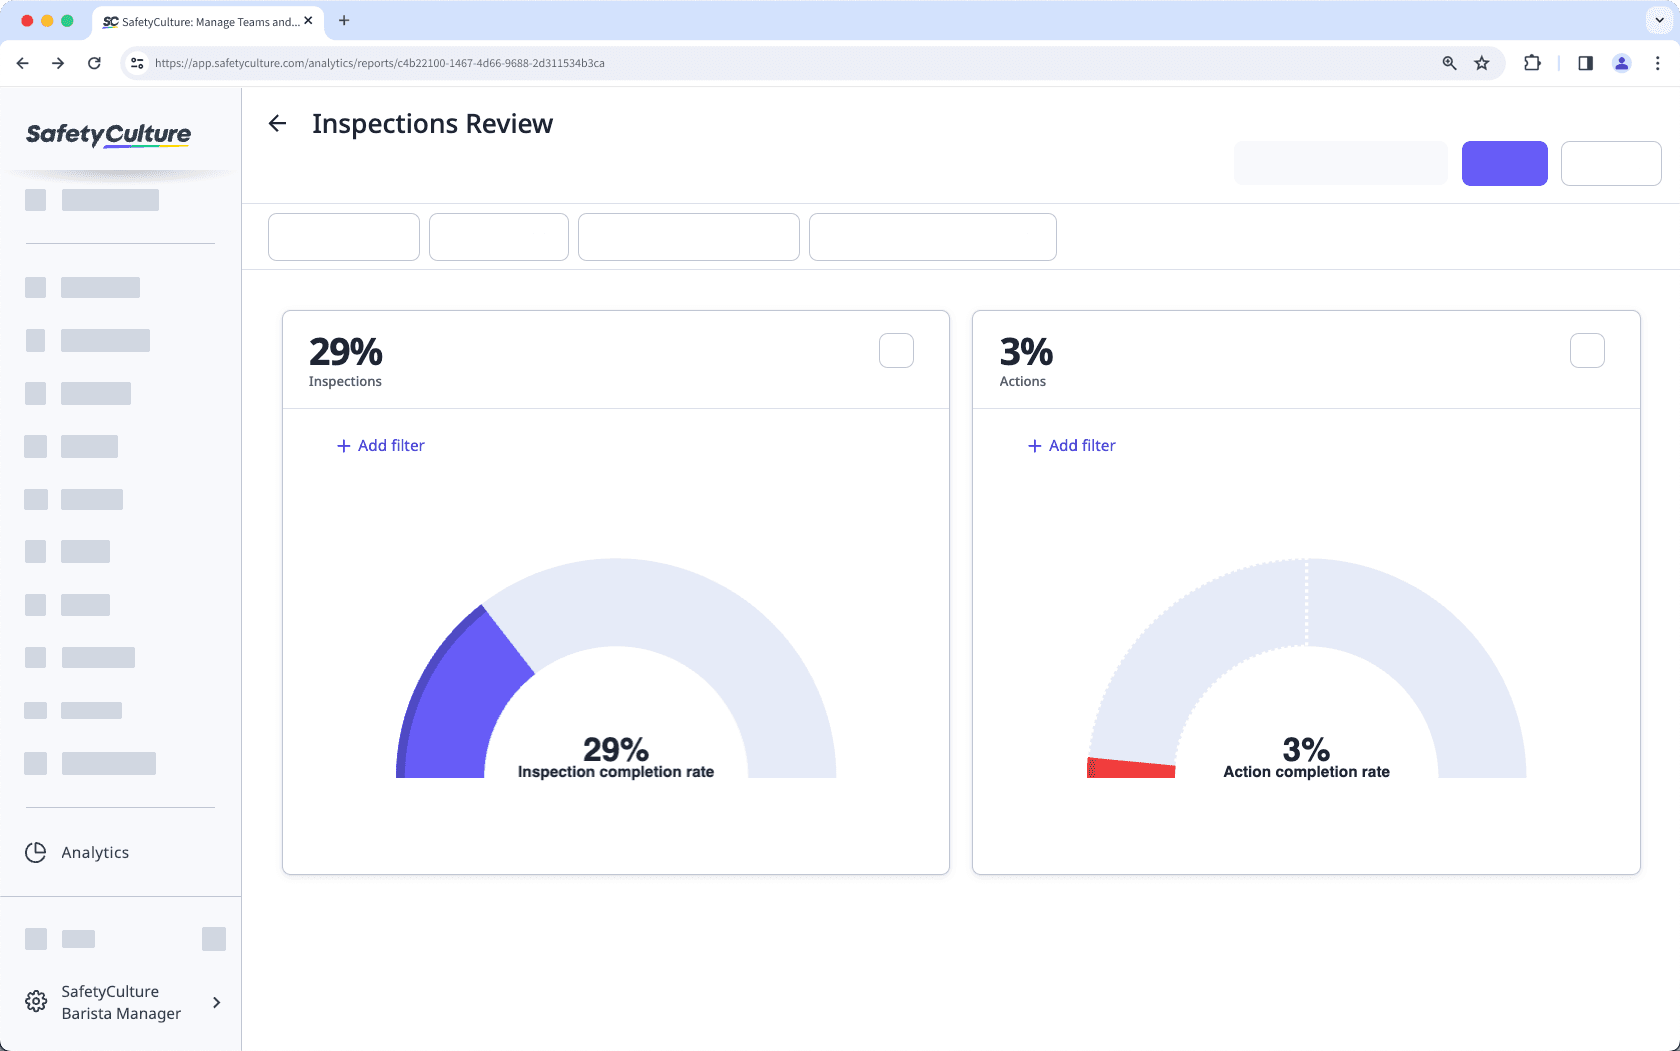
Este tipo de gráfico le permite ver el rendimiento de su equipo. Puede configurar un gráfico de KPI (indicadores clave de rendimiento) para determinar si su equipo está cumpliendo o no con los objetivos establecidos.
Tenga en cuenta que solo se admiten métricas basadas en porcentajes (%) para este tipo de gráfico.
Este tipo de gráfico le proporciona un resumen de las tendencias de los datos durante un periodo de tiempo seleccionado. Puede elegir una métrica mediante dos atributos: uno basado en la fecha y otro no basado en la fecha. Actualmente no se admiten las inspecciones programadas.
Este tipo de gráfico le permite ver un desglose de las respuestas de inspecciones, en función de su pregunta, secciones y páginas.
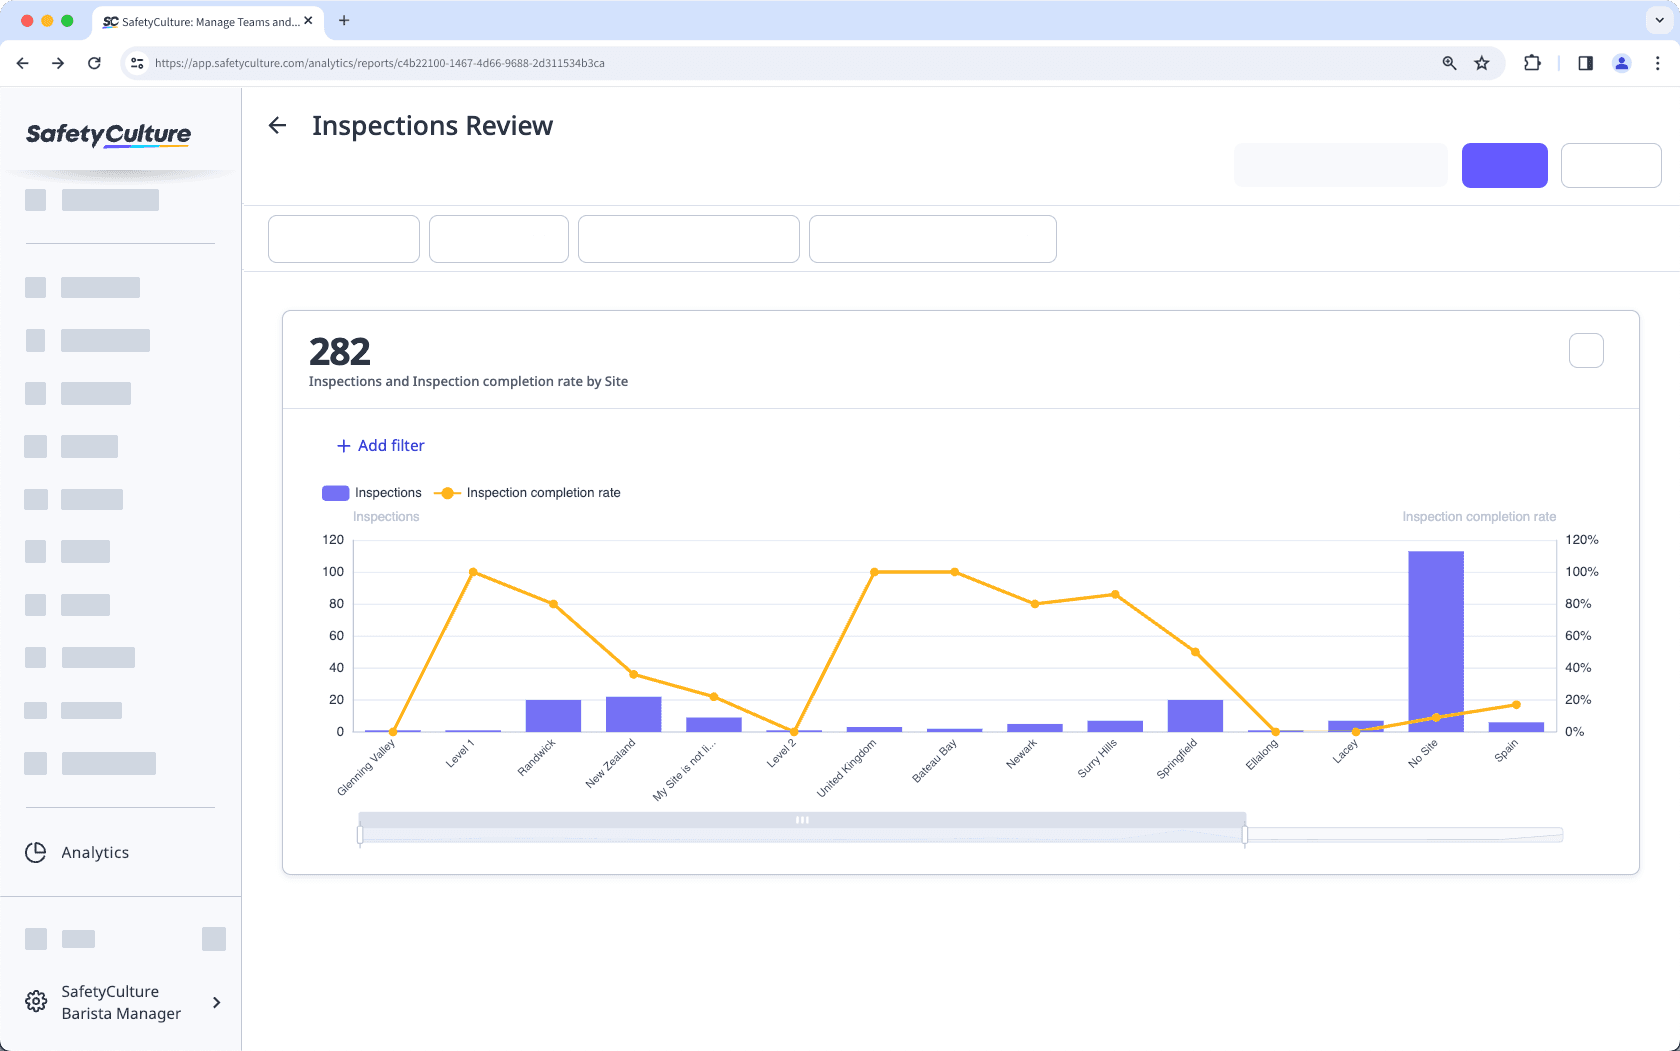
Este tipo de gráfico le deja comparar dos métricas diferentes por atributo, lo que le permite identificar cualquier correlación o tendencia entre las métricas seleccionadas. Cada métrica seleccionada se representa mediante un gráfico de columnas y uno de líneas, respectivamente.
Solo puede seleccionar métricas del mismo tipo de datos para cada gráfico. Por ejemplo, si ha seleccionado «Inspecciones (recuento)» como la primera métrica, la segunda métrica debe seleccionarse del tipo de datos de Inspecciones, como «Tasa de finalización de inspecciones».
Cambiar el tipo de un gráfico
Select
Estadísticas in the sidebar or select it in
Más.
Click
on the upper-right corner of the chart.
Click the dropdown under "Chart type" and select the relevant chart type for your data.
Click Guardar gráfico on the upper-right of the page to save the changes to the chart.
Click Guardar on the upper-right of the page to save the changes to your dashboard.
¿Esta página le fue de ayuda?
Gracias por hacérnoslo saber.