Configurar KPI de gráficos
Aprenda a configurar KPI en sus gráficos para facilitar el seguimiento del rendimiento a través de la aplicación web.¿Por qué configurar KPI en gráficos?
Configurar KPI en sus gráficos le ayuda a supervisar el progreso hacia objetivos específicos y a comprender el rendimiento de su equipo en tiempo real. Al añadir uno o más KPI a sus paneles, puede supervisar métricas clave, detectar tendencias, comparar resultados y tomar medidas cuando las cosas se desvíen.
Al establecer KPI claros, convierte sus paneles en herramientas de rendimiento en vivo que ayudan a su equipo a tomar decisiones informadas y a mantenerse alineados en lo que constituye el éxito.
Puede tener hasta 5 valores de KPI por gráfico.
Configurar el KPI de un gráfico
Seleccione
 Estadísticas en el menú de la izquierda.
Click
 en la esquina superior derecha del gráfico.
Seleccione Ajustes de gráficos, y luego seleccioneConfiguración de KPI.
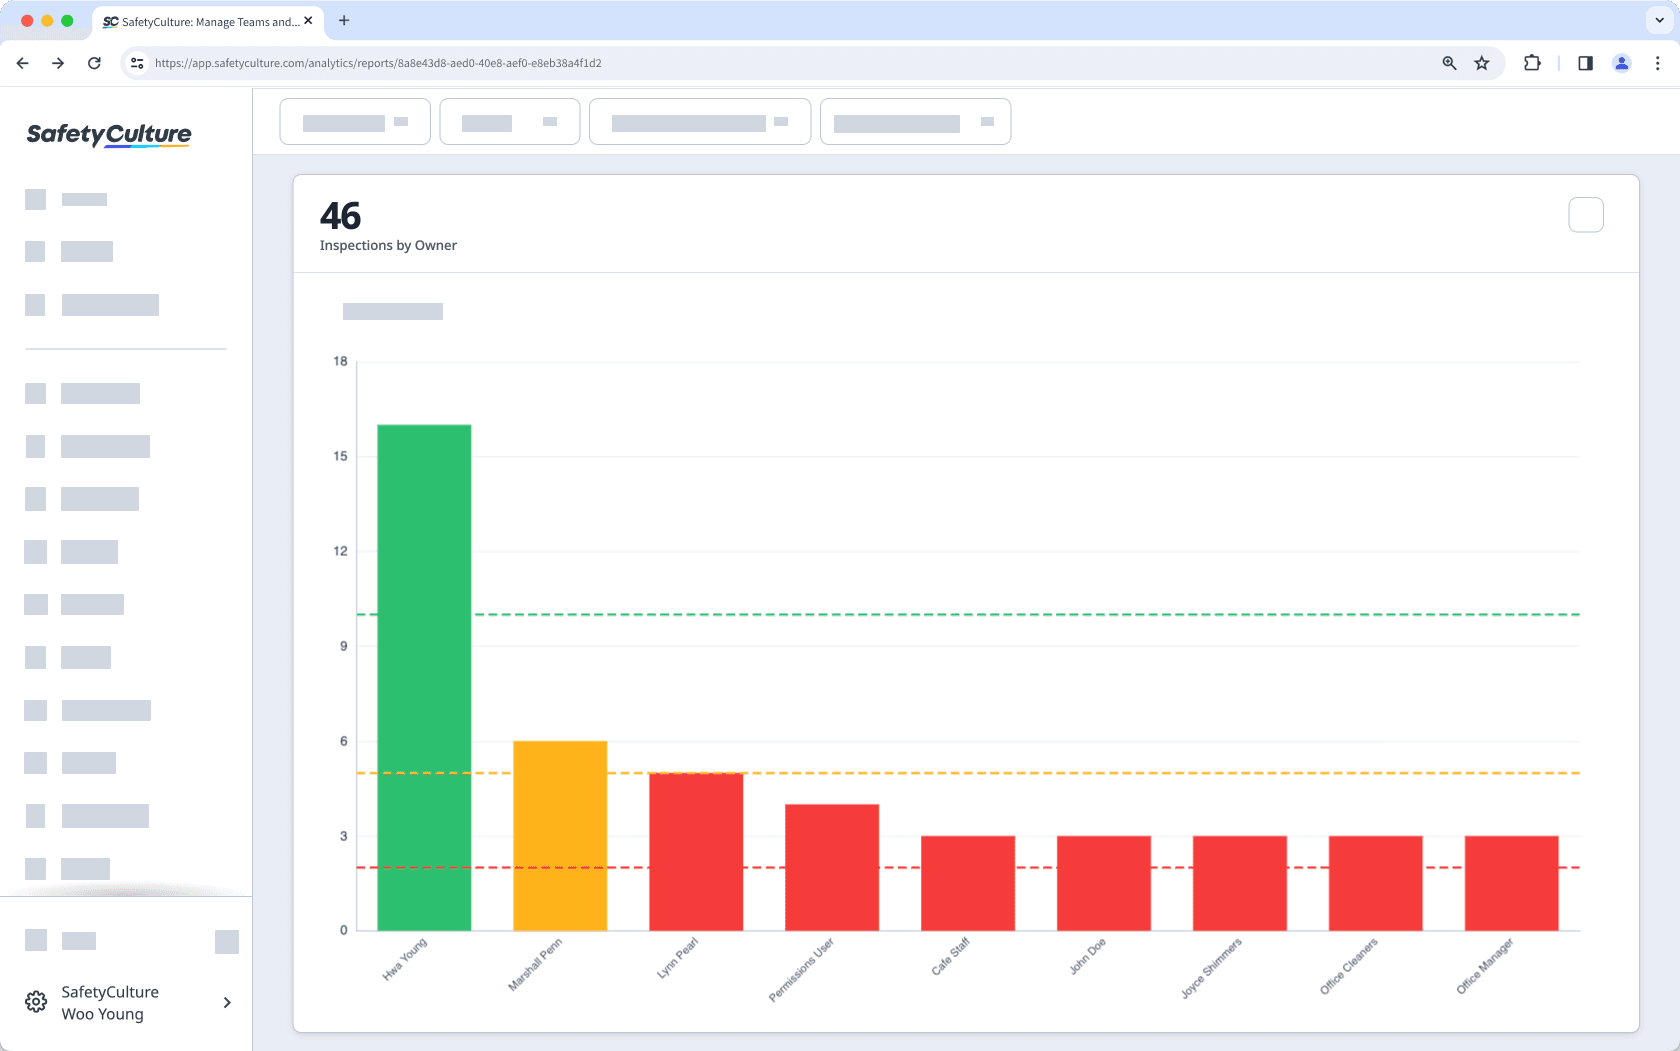
En la ventana emergente, añada un nombre y un valor objetivo que se mostrará como una línea de indicador en el gráfico.
Dependiendo del tipo de gráfico, puede activar la opción «Actualizar colores del gráfico» para indicar si los valores están por encima o por debajo del KPI objetivo.
Para el gráfico de «Tabla cronológica», puede seleccionar entre «Números codificados por colores» e «Iconos» para mostrar si se alcanza o no el objetivo.
Haga clic en Guardar, después haga clic en Guardar gráfico en la parte superior derecha de la página.
Haga clic en Guardar en la parte superior derecha de la página para guardar los cambios en su panel.
Para un solo valor de KPI, utilice "Línea" o "Guiones" como tipo de visualización para que el objetivo sea más fácil de leer en el gráfico.
Limitaciones
La configuración de KPI no está disponible para los tipos de gráficos "Circular", "Tabla", "Tabla de respuestas" y "Doble eje".
Preguntas frecuentes
Al añadir varios valores de KPI a un gráfico, cada valor define dónde comienza un nuevo rango de rendimiento. Esto le ayuda a realizar un seguimiento del rendimiento en diferentes umbrales.
Por ejemplo, con estos valores de KPI:
0 = Umbral mínimo
41 = Umbral óptimo
76 = Umbral máximo
El gráfico mostrará:
0-40: Rango mínimo
41-75: Rango óptimo
A partir de 76: Rango máximo
Cada rango se basa en el anterior, por lo que los valores que introduzca determinan dónde comienza cada rango.

Al configurar el estilo del indicador de objetivo de un gráfico de "Cuadro cronológico" como "Iconos", se añade automáticamente un valor base. Este valor base representa los resultados que están por debajo del objetivo establecido, ya que solo se puede definir un valor objetivo con el estilo de "Iconos".
Sí, puede añadir valores negativos a su configuración de KPI. Si sus puntuaciones de inspección incluyen valores negativos, es recomendable establecer el tipo de visualización en "Rangos" para una visualización más clara, ya que facilita distinguir los umbrales de rendimiento de un vistazo.
¿Esta página le fue de ayuda?
Gracias por hacérnoslo saber.