Última actualización:

Ver el rendimiento de la inspección en Estadísticas

Aprenda a ver e interactuar con el rendimiento de las puntuaciones de las inspecciones de su organización en la función de Estadísticas en la aplicación web.

¿Por qué ver el rendimiento de la inspección en Estadísticas?

El rendimiento de las inspecciones realiza un seguimiento de la puntuación que los usuarios han obtenido en cada inspección. Esto le permite detectar tendencias en su organización y resolver cualquier contratiempo que pueda estar causando puntuaciones bajas.

The data shown in Analytics is dependent on the data you have access to in SafetyCulture and the dashboard type you're using if you're on New Analytics. Learn how to give yourself inspection access or assign yourself the "data access" permission for visibility over all templates and inspections in your organization.

How does scoring in Analytics work?

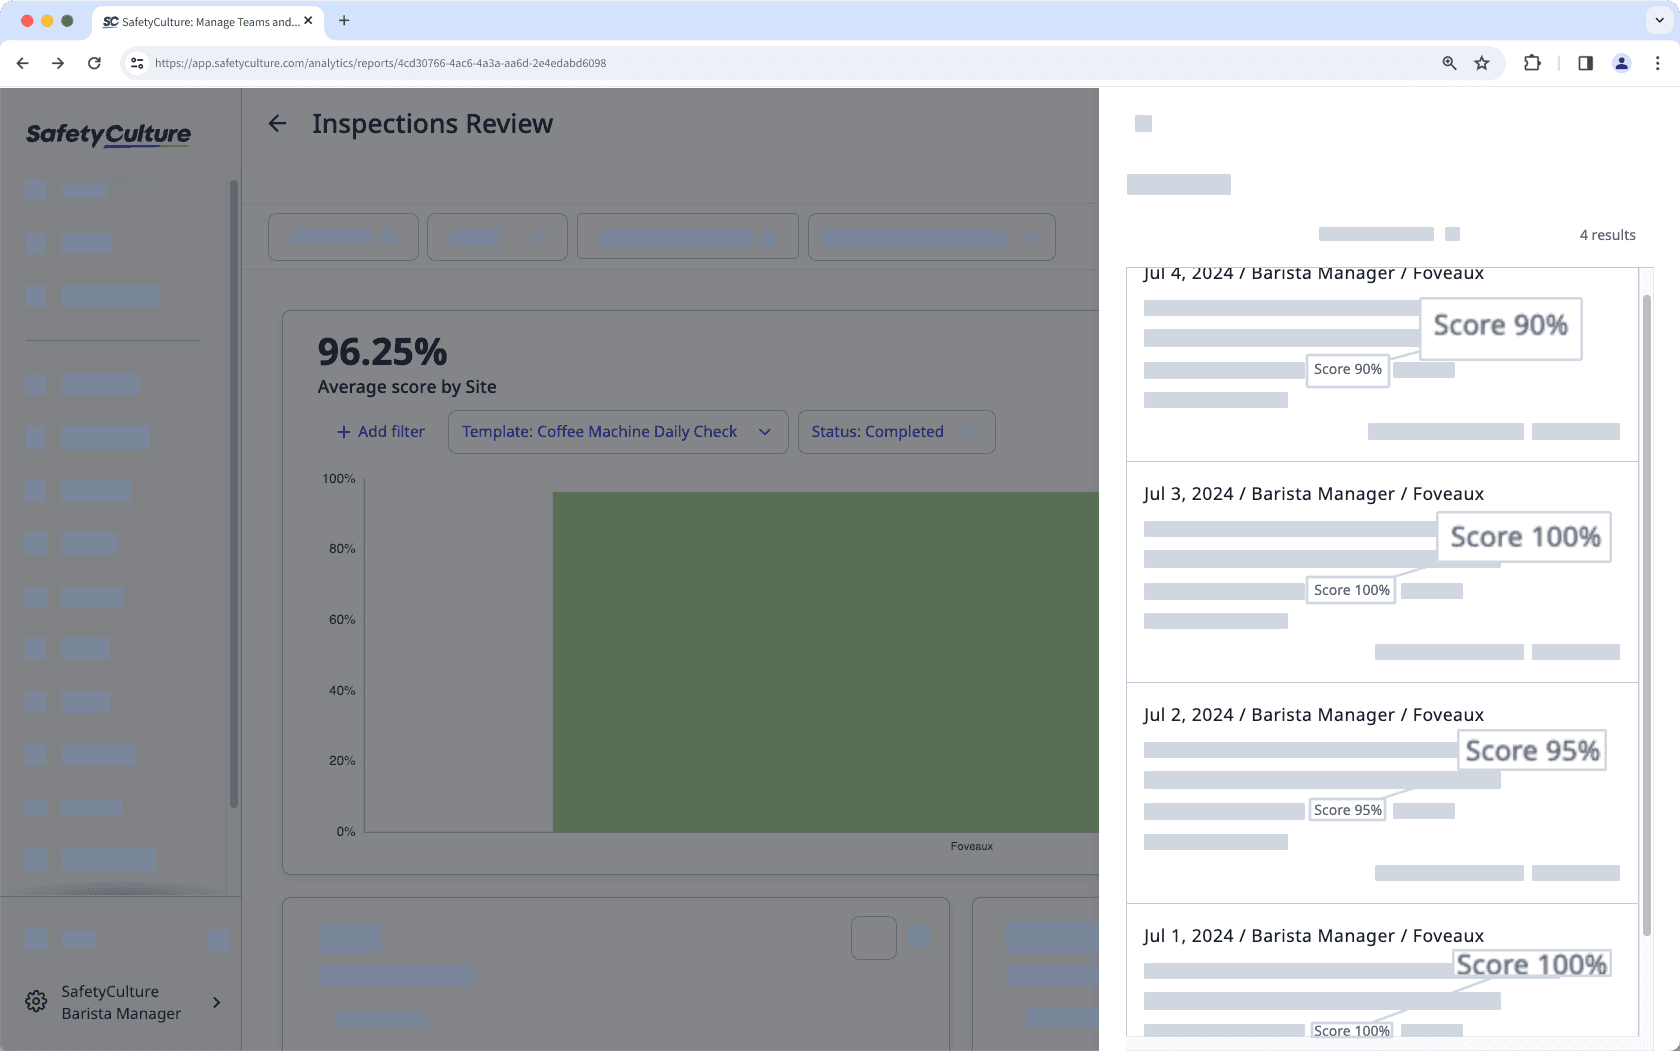
The average score in New Analytics is calculated by adding up all the score percentages and then dividing by the number of inspections.

For example, if you have 4 inspections with scores of 90%, 100%, 95%, and 100%, the average score is calculated like this:

  • (90+100+95+100)/4 = 96.25%

An example of how average inspection scores are computed in Legacy Analytics via the web app.

In Legacy Analytics, the average score is calculated at the question level. This means all the scores a user has achieved are added up and divided by the maximum possible score for the inspection, then multiplied by 100 to get a percentage.

For example, you have 4 inspections with a total score of 182.75, and the maximum possible score is 190. Dividing these and multiplying by 100 gives you an average score of 96.18%.

An example of how average inspection scores are computed in Legacy Analytics via the web app.

You can check an inspection's score by checking the inspection report. In this example, the total item score is 45, while the maximum score is 50.

An example of an inspection score via the web app.

You need to set up scoring in your templates to capture and track question or item scores in your organization.

Ver el rendimiento de la inspección

  1. Log in to the web app.

  2. Select Estadísticas from the menu on the left-hand side.

  3. Edit an existing dashboard or create a new one.

  4. Create a new chart and select Average score as the metric. View your organization's performance by filtering with the average score metric in Analytics via the web app.

  5. Select your preferred attribute and chart type.

  6. Click Guardar on the upper-right of the page.

  1. Iniciar sesión en la aplicación web.

  2. Seleccione Estadísticas en el menú de la izquierda.

  3. Aplique sus filtros y seleccione la pestaña Rendimiento en la parte superior de la página.

  4. En esta página, verá un gráfico y una tabla en los que se muestran los datos de rendimiento de la inspección. A continuación encontrará más información sobre el gráfico y la tabla y sobre cómo interactuar con cada uno de ellos.

Fields in Legacy Analytics

Chart fields

Field

Description

The data

This chart shows the average inspection score each day, week, month, quarter, or year, depending on how you've applied your date period filter.

Visualization

By default, the chart is visualized as a line chart. But you can convert it to a bar chart by toggling the visualization on the upper-right of the chart.

Export chart

If you require the chart for reporting purposes, you can export the chart as an image file by clicking Exportar on the upper-right of the page and selecting Gráfico en PNG.

View inspections containing flagged items

You can interact with the chart to identify which specific inspections achieved the average on a day, week, month, quarter, or year, by hovering your cursor over the dot or bar to see the average score in the pop-up, and clicking VER INSPECCIONES. This lists all the inspections within the selected period that contain flagged items, which you can export via the Exportar option on the upper-right corner of the page.

Table fields

Field

Description

The data

This table, by default, displays details on the owner, the average score, and the total number of inspections conducted over the period of time. If you want to view performance based on other metrics, you can also sort the table with the following elements by clicking the down arrow on the upper-left corner of the table.

Author: The user who last edited the inspection.

Region: The region of an inspection's selected site.

Area: The area of an inspection's selected site.

Site: The selected site of an inspection.

Template: The template of an inspection.

The table, by default, shows the average score for each question on each day, week, month, quarter, or year, depending on how you've applied your date filter. You can adjust the table to display the minimum or maximum score by clicking the down arrow under % de PUNTUACIÓN on the upper-left of the table.

Export table

If you require the table for reporting purposes, you can export the table as a CSV file by clicking Exportar on the upper-right of the page and selecting Tabla en CSV.

View all inspections

If you want to see the total number of inspections based on how you sorted the table, you can do so by clicking either the sorting label or the total number of inspections on the right-hand side of the row. This lists all the inspections based on the sorting, which you can export via the Exportar option on the upper-right corner of the page.

View inspections based on minimum, average, or maximum score

If you want to see only the inspections that achieved a specific minimum, average, or maximum score on a day, week, month, quarter, or year, you can do so by clicking the score percentage in the table. This lists all the inspections, which you can export via the Exportar option on the upper-right corner of the page.

¿Necesita más ayuda?
En este artículo