- Usar SafetyCulture
- Estadísticas
- Ver el rendimiento de la inspección en Estadísticas
Ver el rendimiento de la inspección en Estadísticas
Aprenda a ver e interactuar con el rendimiento de las puntuaciones de las inspecciones de su organización en la función de Estadísticas en la aplicación web.
¿Por qué ver el rendimiento de la inspección en Estadísticas?
El rendimiento de las inspecciones realiza un seguimiento de la puntuación que los usuarios han obtenido en cada inspección. Esto le permite detectar tendencias en su organización y resolver cualquier contratiempo que pueda estar causando puntuaciones bajas.
Los datos que se muestran en Estadísticas dependen de los datos a los que tiene acceso en SafetyCulture y del tipo de panel que está utilizando si está en Nuevas Estadísticas. Aprenda cómo darse acceso a inspecciones o asignarse el permiso de "acceso a datos" para obtener visibilidad de todas las plantillas e inspecciones de su organización.
¿Cómo funciona la puntuación en Estadísticas?
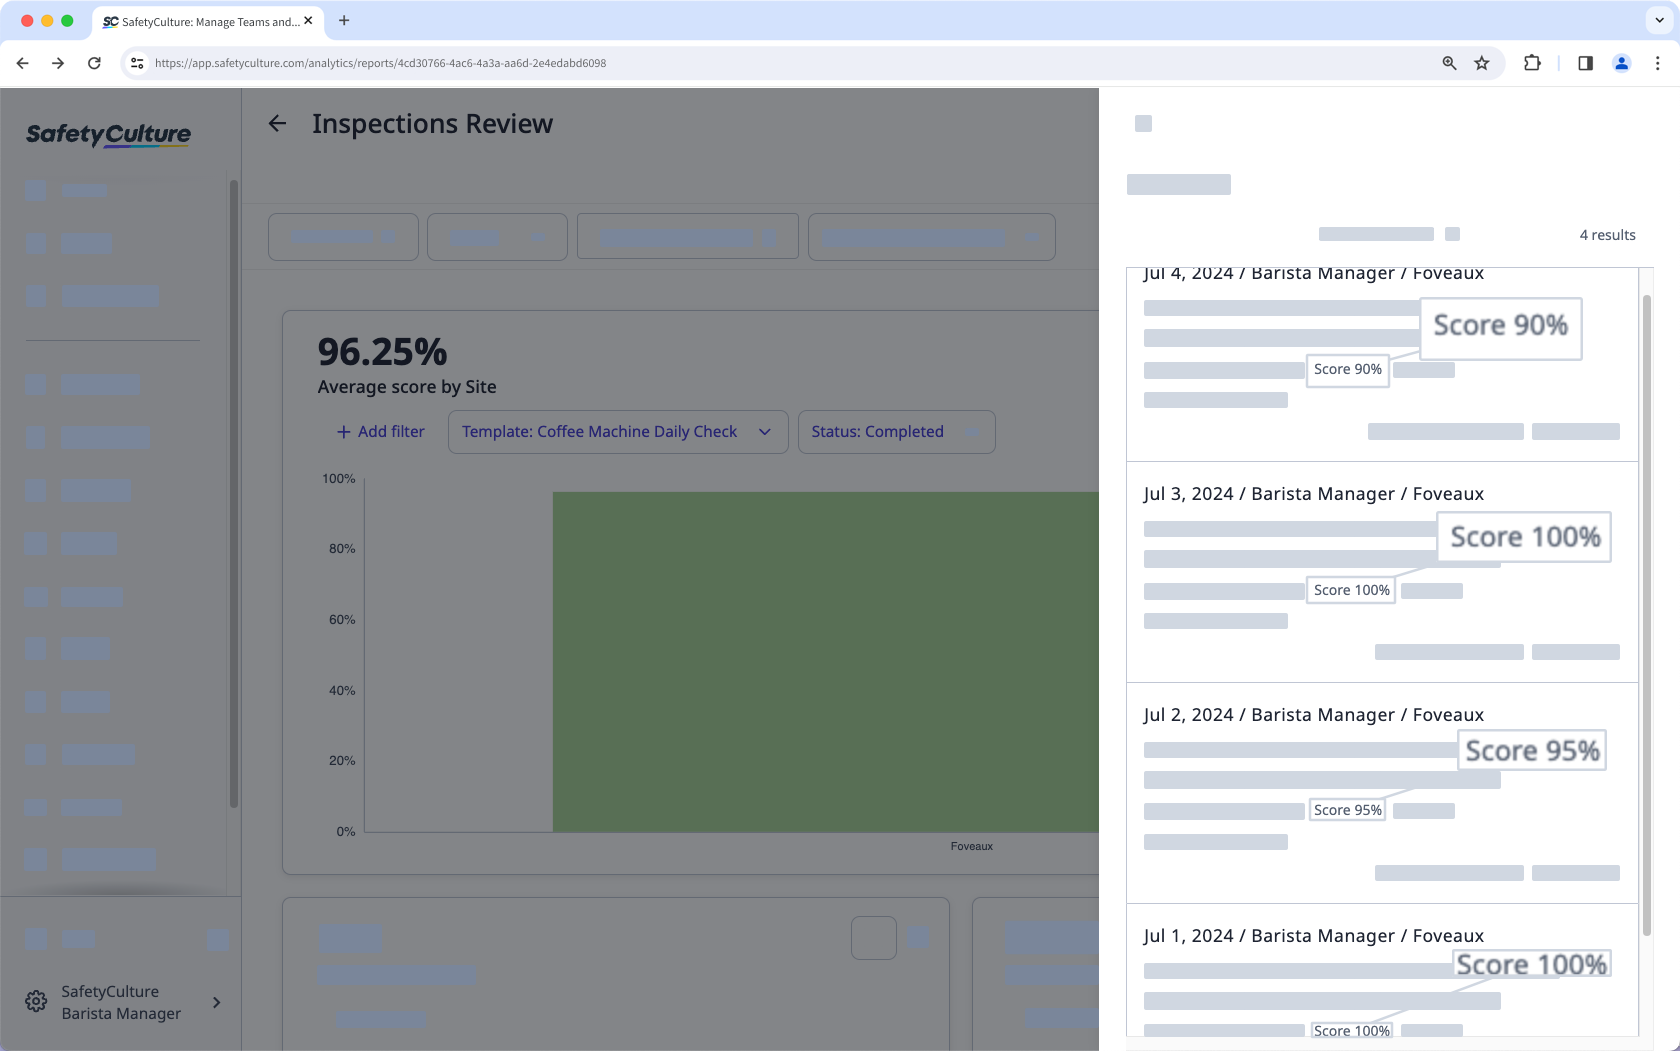
La puntuación media en Nuevas Estadísticas se calcula sumando todos los porcentajes de puntuación y luego dividiéndola entre el número de inspecciones.
Por ejemplo, si tiene 4 inspecciones con puntuaciones de 90 %, 100 %, 95 % y 100 %, la puntuación media se calcula así:
(90+100+95+100)/4 = 96,25 %

En Estadísticas heredadas, la puntuación media se calcula a nivel de pregunta. Esto significa que todas las puntuaciones obtenidas por un usuario se suman y se dividen entre la puntuación máxima posible para la inspección y luego se multiplican por 100 para obtener un porcentaje.
Por ejemplo, tiene 4 inspecciones con una puntuación total de 182,75 y la puntuación máxima posible es 190. Dividirlas y multiplicarlas por 100 da una puntuación media de 96,18 %.

Puede comprobar la puntuación de una inspección consultando el informe de la inspección. En este ejemplo, la puntuación total del elemento es 45, mientras que la puntuación máxima es 50.

Debe configurar la puntuación en sus plantillas para capturar y realizar un seguimiento de las puntuaciones de preguntas o elementos en su organización.
Ver el rendimiento de la inspección
Select
Estadísticas from the menu on the left-hand side.
Create a new chart and select Puntuación media as the metric.
Select your preferred attribute and chart type.
Click Guardar on the upper-right of the page.
Seleccione
Estadísticas en el menú de la izquierda.
Aplique sus filtros y seleccione la pestaña Rendimiento en la parte superior de la página.
En esta página, verá un gráfico y una tabla en los que se muestran los datos de rendimiento de la inspección. A continuación encontrará más información sobre el gráfico y la tabla y sobre cómo interactuar con cada uno de ellos.
Fields in Legacy Analytics
Chart fields
Field | Description |
---|---|
The data | This chart shows the average inspection score each day, week, month, quarter, or year, depending on how you've applied your date period filter. |
Visualization | By default, the chart is visualized as a line chart. But you can convert it to a bar chart by toggling the visualization on the upper-right of the chart. |
Export chart | If you require the chart for reporting purposes, you can export the chart as an image file by clicking Exportar on the upper-right of the page and selecting Gráfico en PNG. |
View inspections containing flagged items | You can interact with the chart to identify which specific inspections achieved the average on a day, week, month, quarter, or year, by hovering your cursor over the dot or bar to see the average score in the pop-up, and clicking VER INSPECCIONES. This lists all the inspections within the selected period that contain flagged items, which you can export via the Exportar option on the upper-right corner of the page. |
Table fields
Field | Description |
---|---|
The data | This table, by default, displays details on the owner, the average score, and the total number of inspections conducted over the period of time. If you want to view performance based on other metrics, you can also sort the table with the following elements by clicking the down arrow on the upper-left corner of the table. Author: The user who last edited the inspection. Region: The region of an inspection's selected site. Area: The area of an inspection's selected site. Site: The selected site of an inspection. Template: The template of an inspection. The table, by default, shows the average score for each question on each day, week, month, quarter, or year, depending on how you've applied your date filter. You can adjust the table to display the minimum or maximum score by clicking the down arrow under % de PUNTUACIÓN on the upper-left of the table. |
Export table | If you require the table for reporting purposes, you can export the table as a CSV file by clicking Exportar on the upper-right of the page and selecting Tabla en CSV. |
View all inspections | If you want to see the total number of inspections based on how you sorted the table, you can do so by clicking either the sorting label or the total number of inspections on the right-hand side of the row. This lists all the inspections based on the sorting, which you can export via the Exportar option on the upper-right corner of the page. |
View inspections based on minimum, average, or maximum score | If you want to see only the inspections that achieved a specific minimum, average, or maximum score on a day, week, month, quarter, or year, you can do so by clicking the score percentage in the table. This lists all the inspections, which you can export via the Exportar option on the upper-right corner of the page. |
¿Esta página le fue de ayuda?
Gracias por hacérnoslo saber.