- Using SafetyCulture
- Analytics [Legacy]
- View question score trends in legacy Analytics
View question score trends in legacy Analytics
Learn how to view and interact with your organization's question or item score data in the legacy Analytics feature via the web app.
This article covers the legacy Analytics experience. You can track item scores in the new Analytics experience.
What can I see in terms of score trends in Analytics?
Score trends in Analytics show the scores of each question in your templates, making it easy to spot and address low score patterns. To get started, make sure you set up scoring in your templates so you can capture and track question or item scores across your team.
What you'll need
You can view average inspection scores easily in the new Analytics.
The data shown in Analytics is dependent on the data you have access to in SafetyCulture. Learn how to give yourself inspection access or assign yourself the "Override permissions: View all data" permission for visibility over all templates and inspections in your organization.
View items scores
Select
 Analytics from the menu on the left-hand side.
Toggle Legacy on the upper-left of the page.
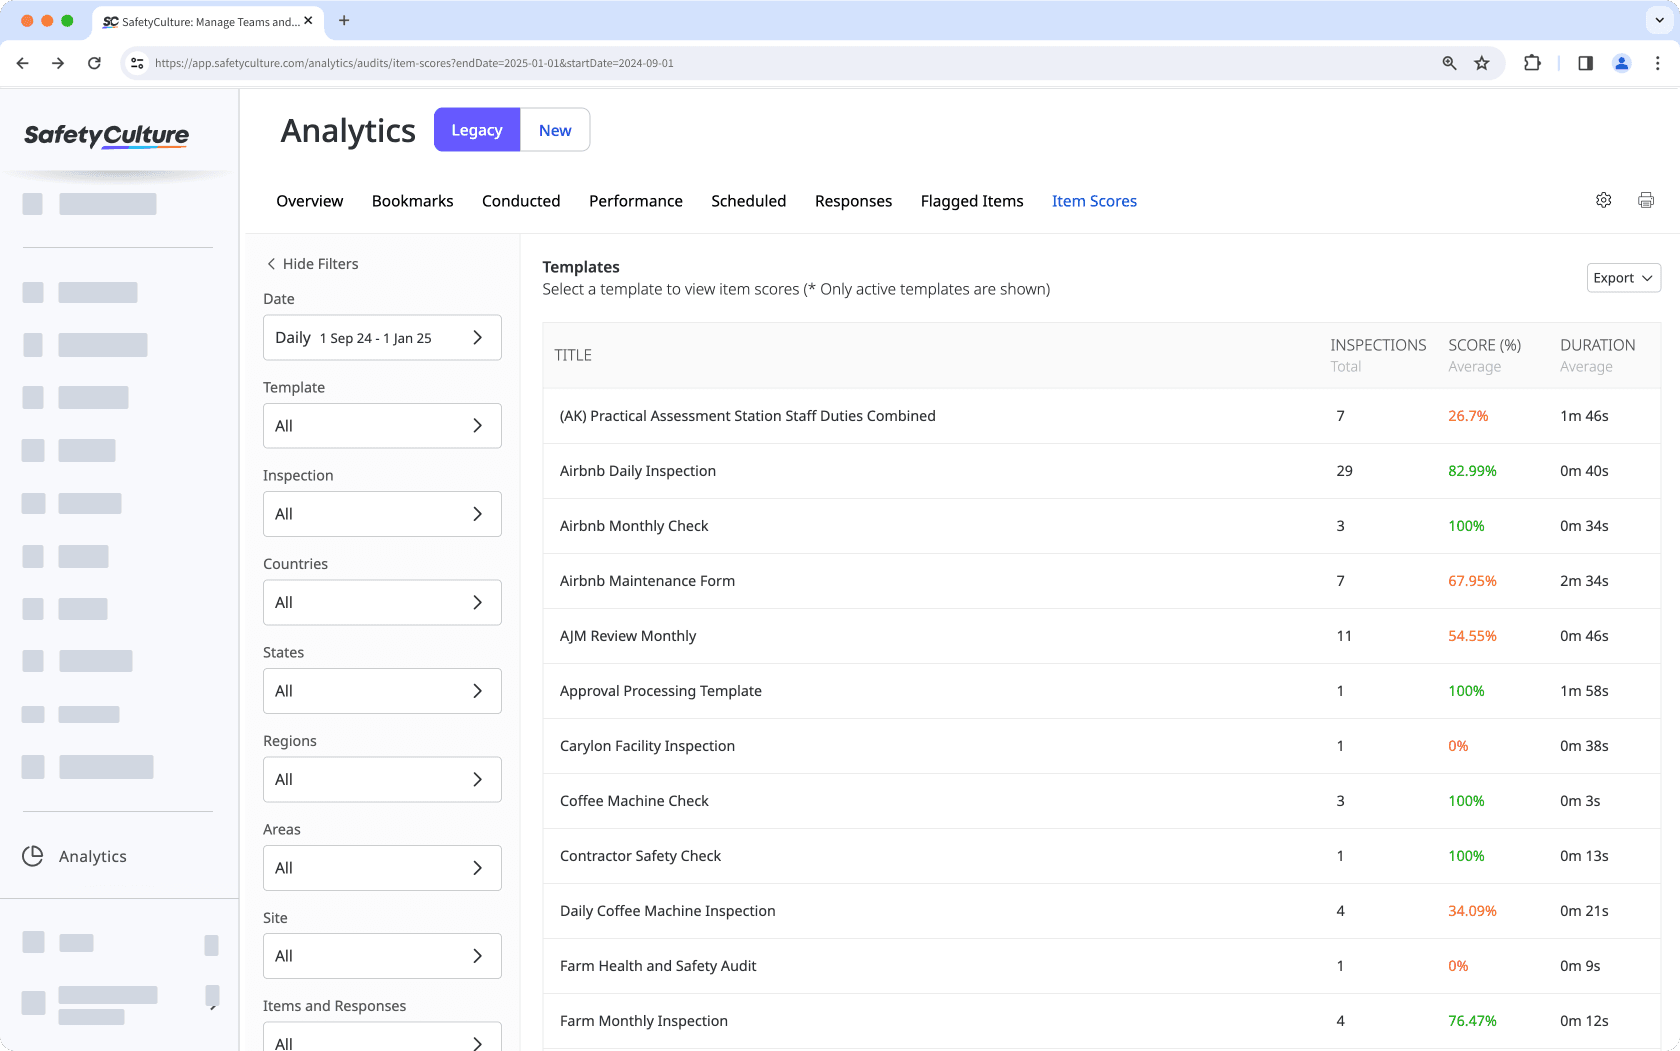
Apply your filters and select the Item Scores tab on the top of the page.
On this page, you can see a table listing the templates available to you. Each displaying the total number of inspections conducted, the average score in percentage, and the average inspection duration. If you require the table for reporting purposes, you can export the table as a CSV file by clicking Export on the upper-right of the page and selecting Table as CSV.
Click the template.
On this page, you will see a table listing all questions or items in the selected template. You can learn more about the table and how you can interact with the data it contains in the next section.
Table fields
Field | Description |
|---|---|
The data | This table includes the list of all of the scored questions within the template as well as the sections they are part of. The table by default shows the average score for each question on each day, week, month, quarter, or year, depending on how you've applied your date filter. You can adjust the table to display the minimum or maximum score by clicking the down arrow under SCORE % on the upper-left of the table |
Export table | If you require the table for reporting purposes, you can export the table as a CSV file by clicking Export on the upper-right of the page and selecting Table as CSV. |
Was this page helpful?
Thank you for letting us know.