Why track training progress in Analytics?
Tracking course progress is available in both Training and Analytics. Analytics gives you a more accurate and up-to-date view because it updates as data changes. You can see at a glance who is completing their courses and who still needs to catch up. Training gaps are easy to miss when you're managing recurring courses across multiple teams. You can also export the data as a CSV to follow up with at-risk users or share progress with managers.
What's the difference between the training matrix in Training and the training matrix in Analytics?
What's different | Training matrix in Training | Training matrix in Analytics |
|---|---|---|
Translated courses | Translated courses using the legacy translations are grouped under the original course as a single entry | Each translated course using the legacy translations appears as its own separate column or row |
Users with no active training assigned | Users whose training access was removed continue to appear | Users with no active mandatory courses assigned are automatically filtered out |
Non-learner account types | Certain account types (for example, admin or system accounts) are hidden from the matrix | All users with an active training assignment appear, regardless of account type |
Deactivated and previously assigned users | Shown in the matrix | Not shown |
What you'll need
Track training progress
Only the matrix chart type is supported.
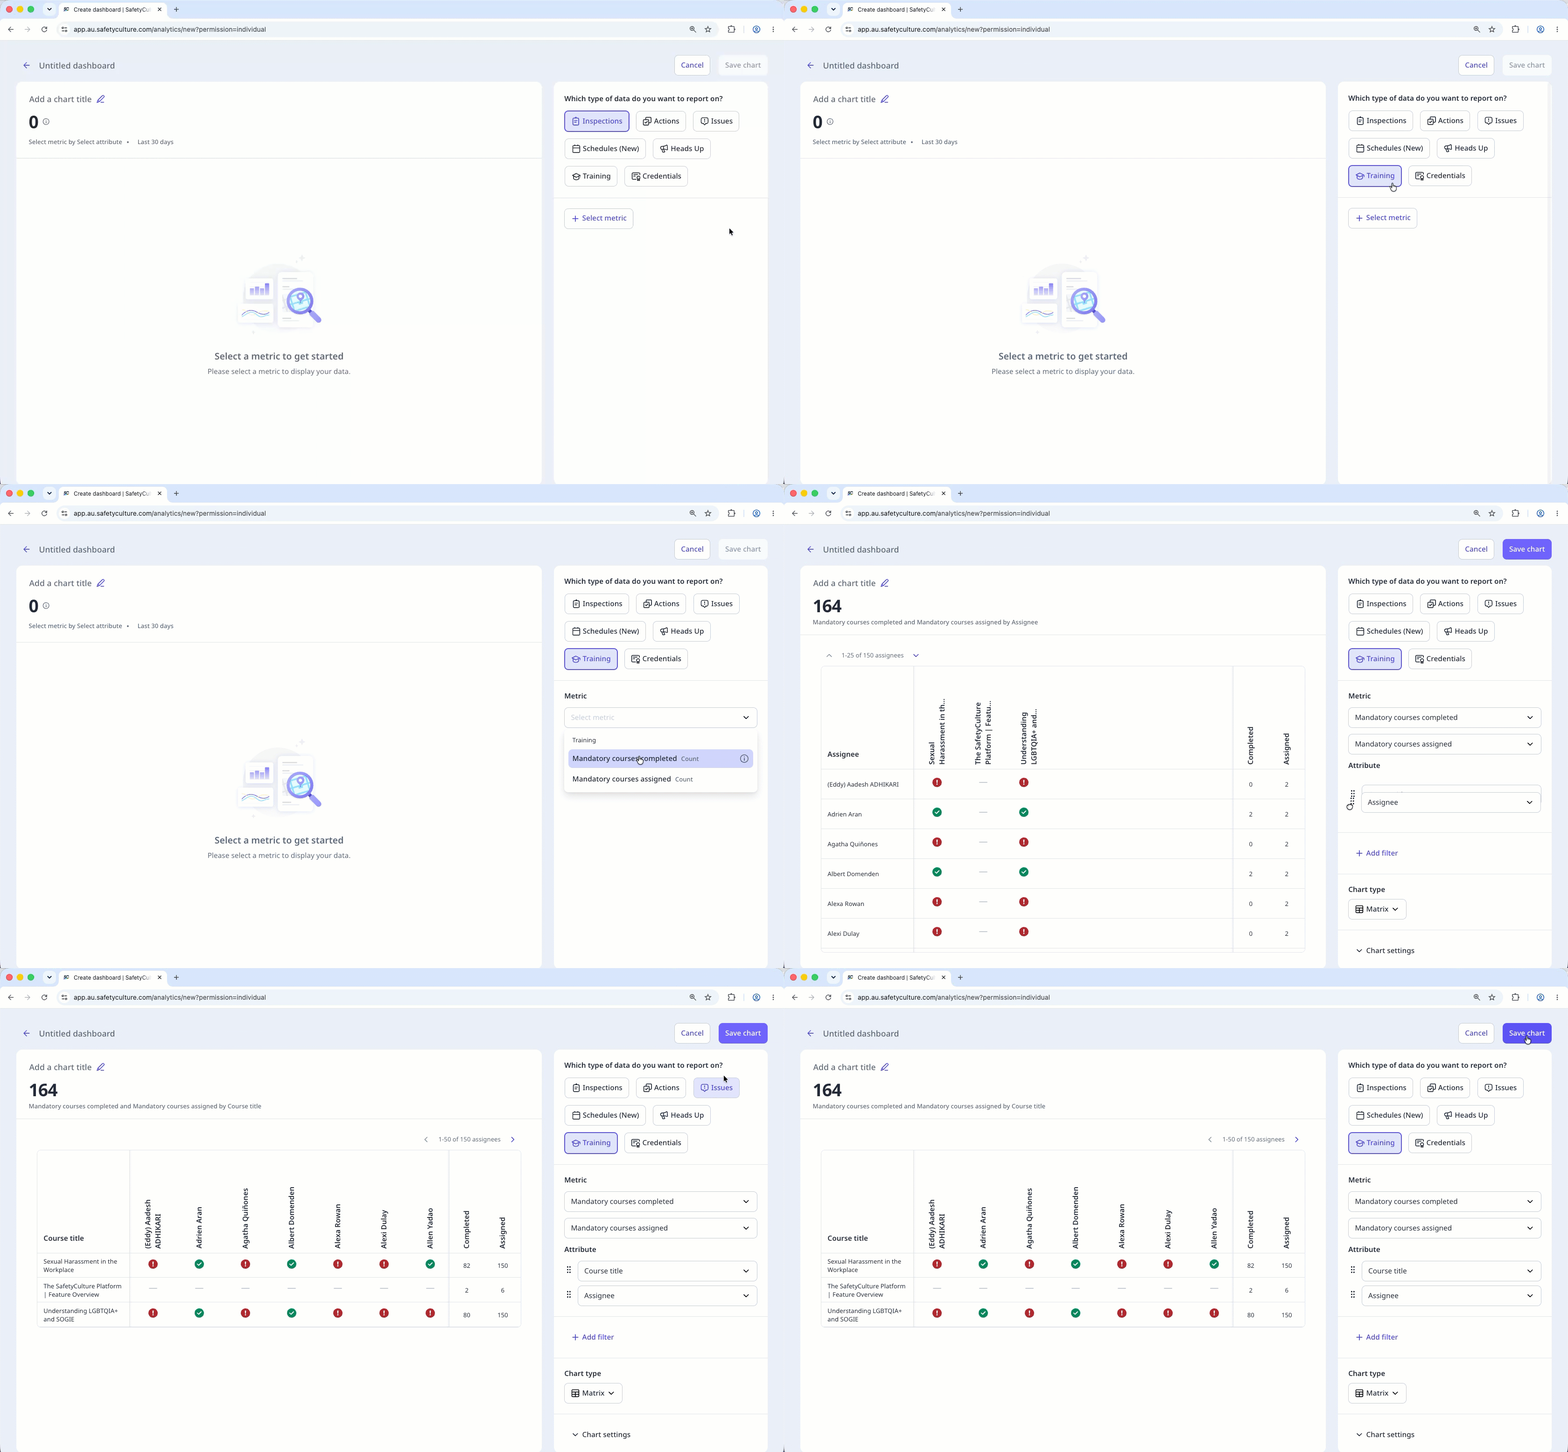
Click Analytics from the sidebar or in More.
Click Add chart on the upper-right of the page, and select Add custom chart.
In the chart builder, configure the data type and metric as follows:
Data type: Select Training from the upper-right of the page.
Metric: Click Select metric and select Mandatory courses completed and Mandatory courses assigned from the dropdown.
Attribute: Drag to reorder the attributes. The first attribute becomes the rows in the matrix, and the count at the top of the chart updates to match.
Configure your chart type accordingly.
Click Save chart on the upper-right of the page to save the changes to the chart.
Click Save on the upper-right of the page to save the changes to your dashboard.
Training matrix statuses
: The course has been completed.
: The course hasn't been started yet.
: The course has been started but hasn't been completed yet. If the course is due in less than 14 days, the status becomes .
: The course hasn't been completed yet and it's due in less than 14 days.
: The course hasn't been completed yet and is past its due date.
: The course is not assigned to the user for completion.
Limitations
Only mandatory courses appear in the matrix.
The matrix reflects your team's current training status. There's no date range or historical view available in this version.
Exports are available in CSV format only. PNG, PDF, Excel, and image downloads aren't supported. Exports respect the column and row filter selections you've applied to the matrix but don't reflect results from the search bar.
The search bar filters by rows only. You can't search by column.
Site filters follow your organization's site hierarchy. When you filter by a child site, the results also include users assigned to its parent site. Users assigned to parent sites can't be excluded from the filtered results.