What is the new Analytics experience?
The new Analytics experience improves the flexibility of creating dashboards that focus on areas of interest and visualize the data in each dashboard.
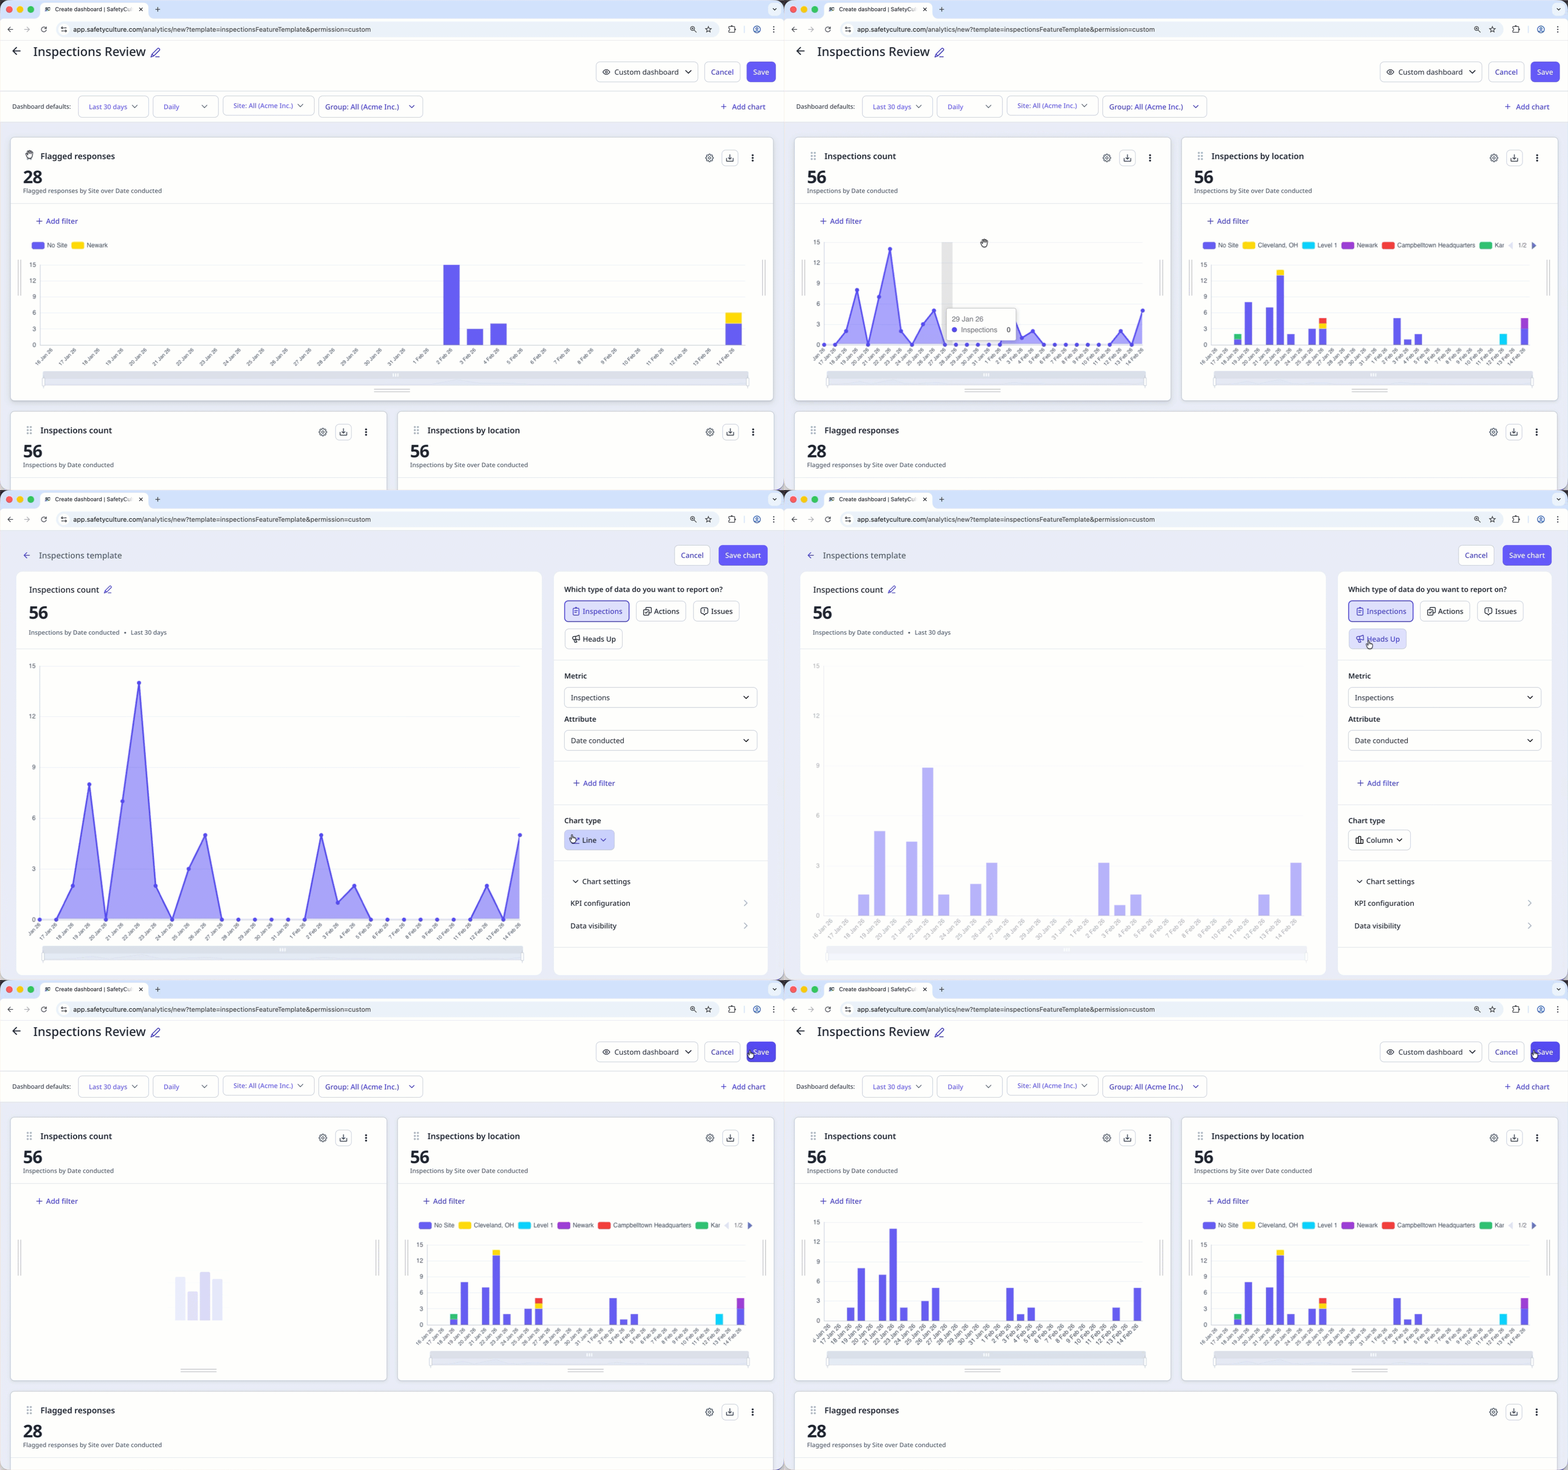
Designed to be more flexible, you can now create dashboards for specific data sets relevant to you with various chart types to help you make sense of the data you're viewing and easily identify trends with the vast customization options. In addition, you can conveniently share the relevant dashboards with your users. Depending on the dashboard type and correct permissions, they can view or manage it as needed.
What you'll need
If your organization still has access to legacy Analytics, you can create a dashboard using the "From Legacy to New" dashboard template.
Create legacy charts and dashboards in new Analytics
We recommend customizing your charts and dashboards to get the most out of your data.