- Usar SafetyCulture
- Estadísticas
- Preguntas frecuentes: Nueva experiencia en Estadísticas
Preguntas frecuentes: Nueva experiencia en Estadísticas
Eche un vistazo a las respuestas a algunas de las preguntas frecuentes sobre la migración a la nueva experiencia de Estadísticas para tu organización en SafetyCulture.¿En qué consiste la nueva experiencia de Estadísticas?
La nueva experiencia de Estadísticas mejora la flexibilidad para crear paneles que se centren en áreas de interés y visualizar los datos en cada uno de ellos.
Diseñado para ser más flexible, ahora puede crear paneles para conjuntos de datos específicos que sean relevantes para usted con varios tipos de gráficos para ayudarle a comprender los datos que está viendo e identificar fácilmente las tendencias con las amplias opciones de personalización. Además, puede compartir fácilmente los paneles relevantes con sus usuarios. Según el tipo de panel y los permisos correctos, podrán verlos o gestionarlos según sea necesario.
¿Cuáles son las diferencias entre la versión heredada y la nueva experiencia?
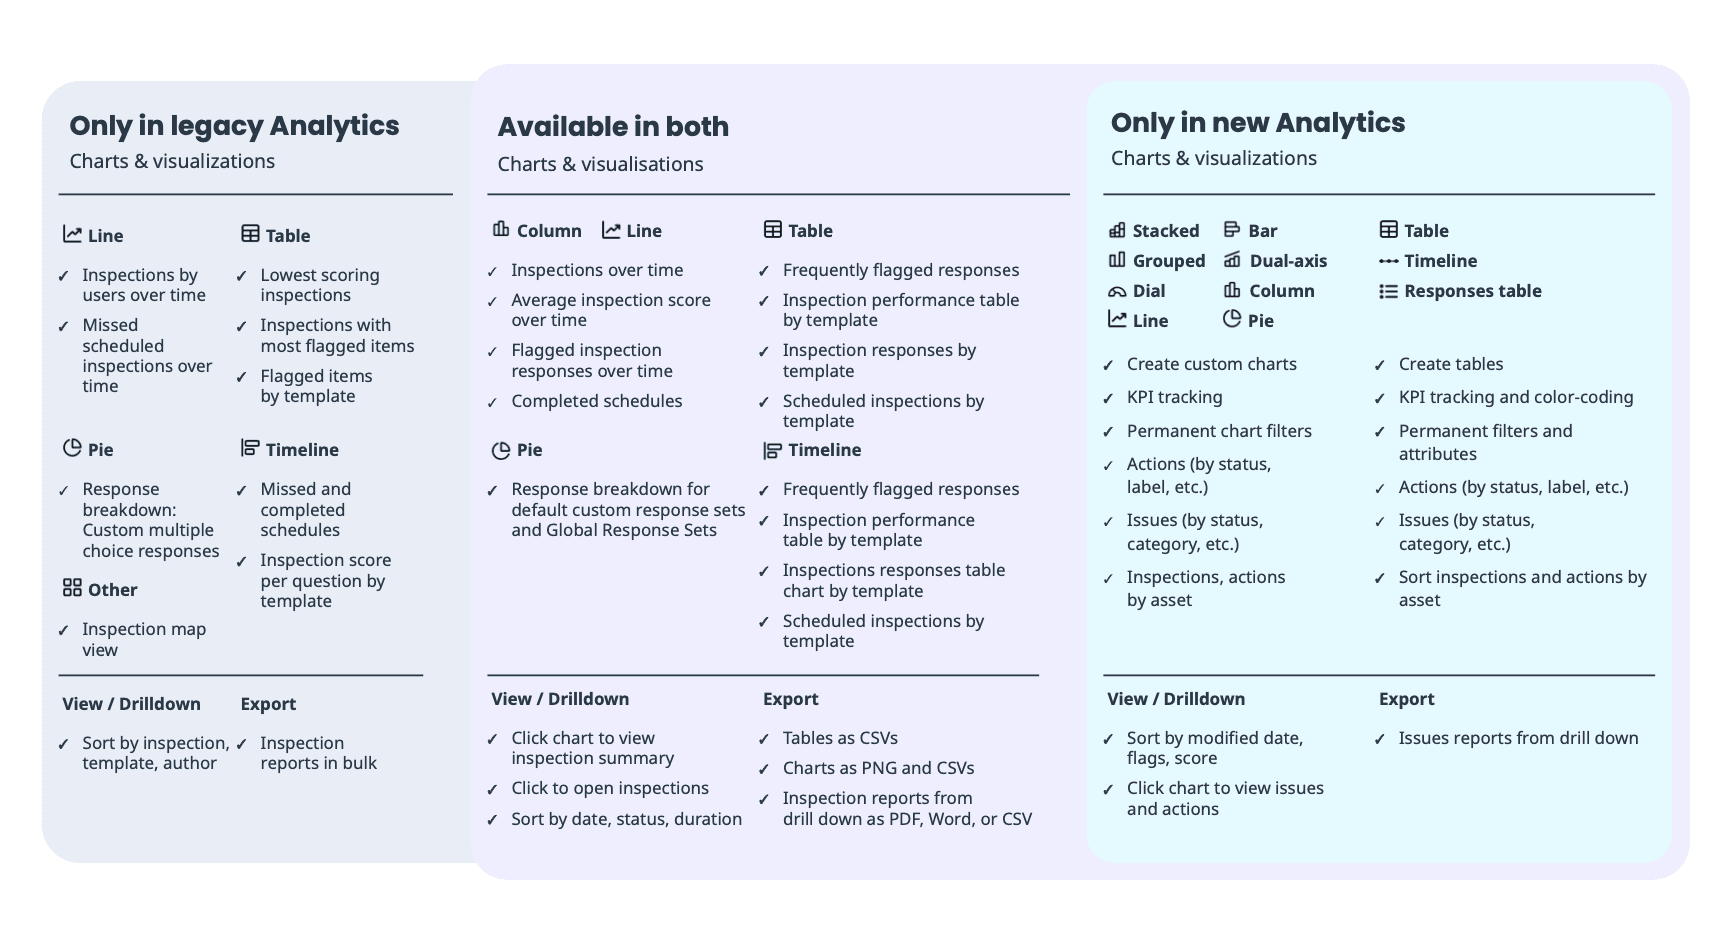
La nueva experiencia de Estadísticas introduce paneles personalizables, filtros intuitivos y una mayor personalización de gráficos, además de una experiencia de usuario mejorada. A diferencia de la versión heredada, que ofrecía opciones fijas y limitadas, la nueva experiencia de Estadísticas permite a los usuarios adaptar la información a sus necesidades.
Con la nueva experiencia de Estadísticas, puede crear paneles, añadir gráficos con diferentes métricas y atributos, realizar el seguimiento de KPI y mucho más.

Preguntas frecuentes
Las Estadísticas heredadas dependen de tecnología obsoleta, lo que limita su fiabilidad y seguridad. La nueva experiencia de Estadísticas está diseñada para ofrecer a su equipo más flexibilidad, funciones potentes y una visión más profunda para mejorar su flujo de trabajo diario. Gracias a sus valiosos comentarios, estamos seguros de que es el momento adecuado para realizar la transición, pues la versión heredada ya no cumple los estándares de rendimiento y funcionalidad que usted se merece.
Avisaremos a su organización por correo electrónico a partir de febrero de 2025. La migración comenzará unas semanas después y continuará hasta mayo. Para asegurar una transición fluida, le recomendamos comenzar a explorar la nueva experiencia de Estadísticas ya mismo.
No, una vez que su organización haya migrado, la experiencia de Estadísticas heredadas dejará de estar disponible. Consulte nuestras guías para ayudarle a realizar la transición completa de su equipo a la nueva experiencia.
Your data will remain accessible, but existing dashboards and bookmarks from legacy Analytics won’t be transferred. Instead, you can create new dashboards and customize charts to meet your organization’s needs.
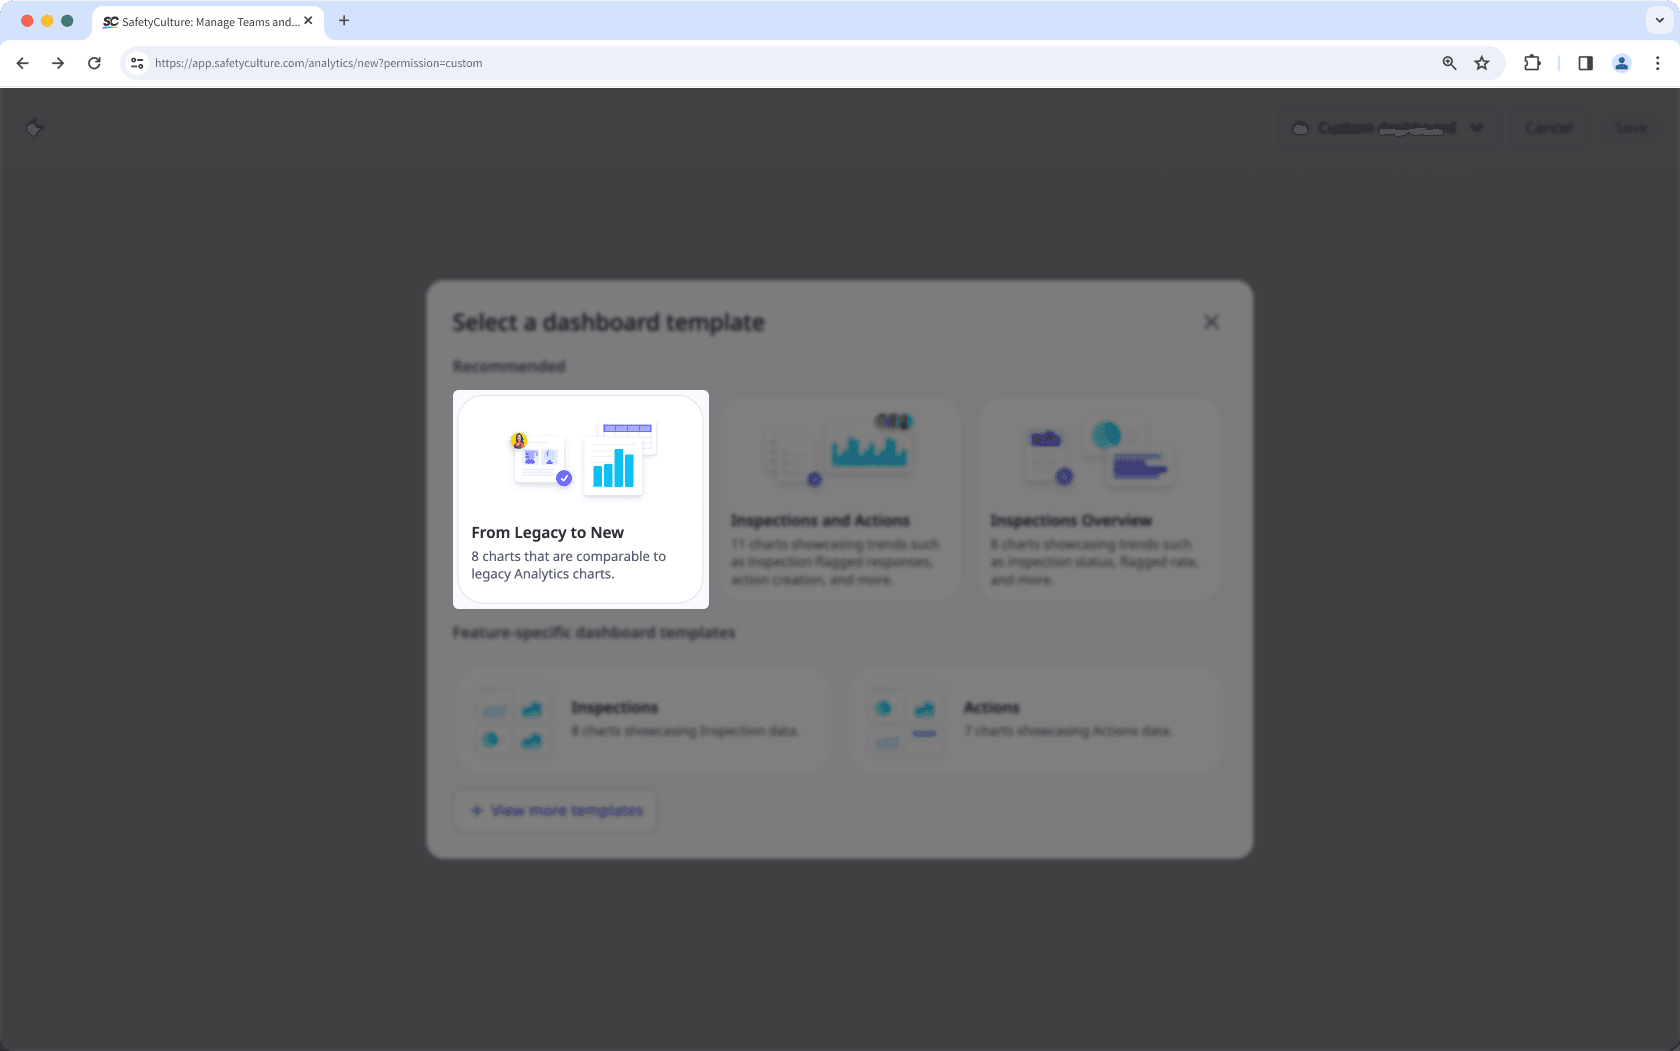
También puede utilizar nuestra plantilla para panel "De heredado a nuevo", diseñada específicamente para recrear sus paneles heredados y brindarle una transición fluida a la nueva experiencia.
Puede utilizar nuestra plantilla de paneles «De heredado a nuevo» al crear un nuevo panel:
Seleccione
Estadísticas from the menu on the left-hand side.
Haga clic en
Crear panel en la esquina superior derecha de la página y seleccione Personalizado.
Seleccione Utilizar una plantilla del panel.
Seleccione De Heredados a Nuevo.
Tenga en cuenta que no todas las funciones heredadas están disponibles en la nueva experiencia. A medida que se introduzcan más funcionalidades, la plantilla del panel se actualizará con gráficos adicionales. Sin embargo, los paneles existentes que usen esta plantilla no se actualizarán automáticamente cuando estos nuevos gráficos estén disponibles, por lo que será necesario que usted añada gráficos o cree un nuevo panel manualmente.
Seguimos mejorando para ofrecer una forma similar pero optimizada de configurar Estadísticas, con más tipos de gráficos y opciones de filtrado disponibles en el futuro.

Los usuarios pueden crear o editar paneles si tienen los permisos necesarios para hacerlo.
Permiso «Estadísticas: ver» : los usuarios pueden ver los paneles a los que tienen acceso explícito después de que el panel haya sido compartido con ellos.
Permiso «Estadísticas: crear paneles (basado en creadores)»: los usuarios pueden crear y editar paneles basados en los datos que han creado, como inspecciones, acciones y contratiempos.
Permiso «Estadísticas: crear paneles (basado en sitios)»: los usuarios pueden crear y editar paneles basados en los datos que han creado los sitios de los que son miembros, como inspecciones, acciones y contratiempos.
Permiso «Estadísticas: gestionar»: los usuarios pueden crear y editar todos los paneles en la organización.
En la nueva experiencia, dispone de una gama más amplia de opciones para descargar los datos de sus gráficos. Puede descargar gráficos como imágenes o archivos CSV, en función de lo que sea relevante para usted. También puede exportar en masa inspecciones, acciones, contratiempos y programas directamente desde los desgloses de sus gráficos.
¿Existe algún modo de exportar informes similares como heredados?
Explore nuestras guías detalladas para aprender más sobre la nueva experiencia. Para obtener ayuda adicional, puede ponerse en contacto con nuestro equipo de soporte técnico. Las Organizaciones con el Plan Enterprise también pueden contactar a sus gestores de cuenta para recibir asistencia personalizada.
Entendemos que la nueva experiencia puede no adaptarse a todas sus necesidades y valoramos sus comentarios. Puede compartir sus comentarios directamente a través de nuestro formulario de comentarios o poniéndose en contacto con nuestro equipo de soporte técnico. Sus comentarios ayudan a dar forma a futuras actualizaciones y mejoras.
¿Esta página le fue de ayuda?
Gracias por hacérnoslo saber.