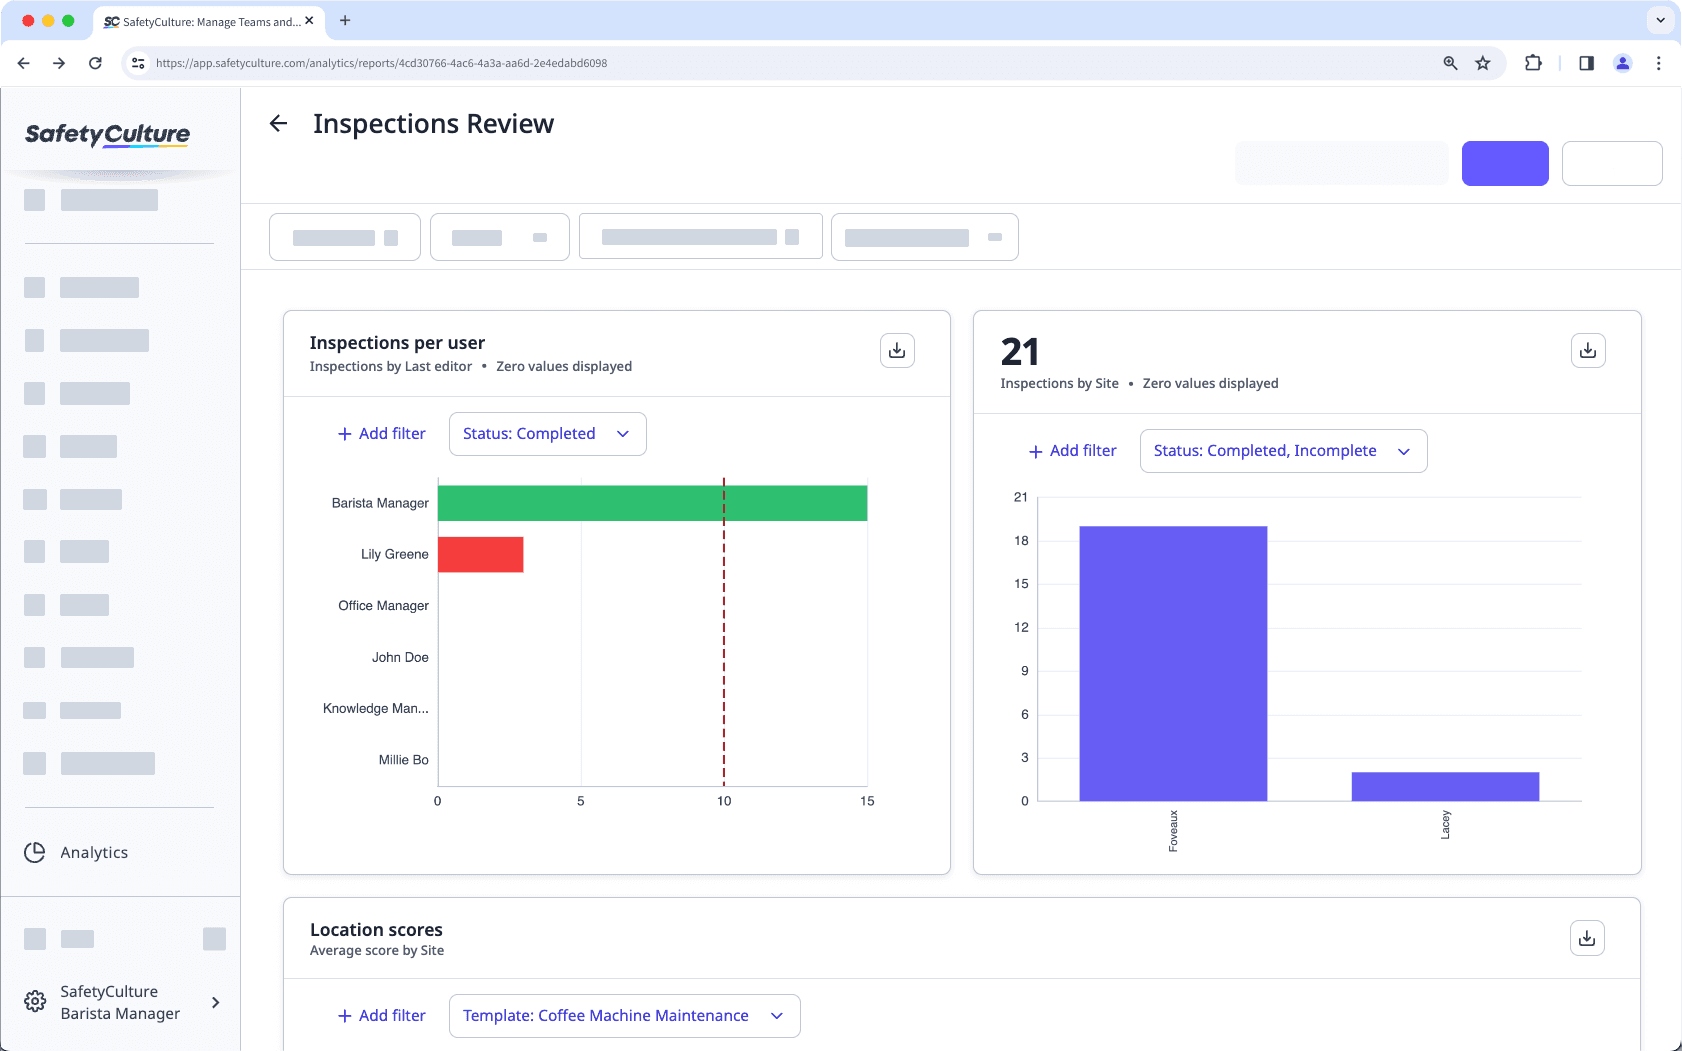
Passen Sie die Sichtbarkeit der Daten in einem Analyse-Diagramm an
Konfigurieren Sie die Datensichtbarkeit für Analysendiagramme in der Web-App, um nur relevante Informationen in Dashboards anzuzeigen oder auszublenden.Was bedeutet es, die Sichtbarkeit der Daten anzupassen?
Um das Beste aus Ihren Analysen-Dashboards herauszuholen, ist es wichtig, die Kontrolle über die anzuzeigenden Daten zu haben. Durch die Anpassung der Datentransparenz in Diagrammen können Sie Nullwerte ein- oder ausblenden und so eine ausnahmebasierte Berichterstattung erstellen, um die Erfolge Ihres Teams hervorzuheben und verbesserungswürdige Bereiche zu identifizieren.
Darüber hinaus können Sie die Gesamtzahl der Metriken in Ihren Diagrammen ausblenden, um die Unordnung in Ihren Dashboards zu reduzieren und sicherzustellen, dass die relevantesten Informationen hervorgehoben werden. Diese Stufe der Anpassung erhöht die Übersichtlichkeit und ermöglicht es Ihrem Team, sich auf das Wesentliche zu konzentrieren.

Nicht zählbare Messwerte wie „Durchschnittliche Dauer“, „Durchschnittliche Bewertung“ usw. zeigen standardmäßig Nullwerte an.
Passen Sie die Sichtbarkeit der Daten in einem Diagramm an
Wählen Sie
Analysen in der Seitenleiste oder in
Mehr aus.
Klicken Sie oben rechts auf dem Diagramm auf
.
Klicken Sie in der Seitenleiste auf Diagramm-Einstellungen und wählen Sie Datensichtbarkeit aus.
Aktivieren oder deaktivieren Sie in der Seitenleiste die Einstellungen für die Datensichtbarkeit nach Bedarf.
Elemente mit Null-Werten anzeigen: Werte anzeigen oder ausblenden, wo keine Daten erstellt wurden.
Gesamtsumme über dem Diagramm ausblenden: Zeigen Sie die Gesamtsumme basierend auf Ihrer konfigurierten Messwerte und Ihrem Attribut in der oberen linken Ecke des Diagramms an oder blenden Sie sie aus.
Klicken Sie oben rechts auf der Seite auf Diagramm speichern, um die Änderungen im Diagramm zu speichern.
Klicken Sie oben rechts auf der Seite auf Speichern, um die Änderungen in Ihrem Dashboard zu speichern.
Bei Diagrammen mit mehreren konfigurierten Attributen werden Nullwerte nur für das erste Attribut angezeigt, mit Ausnahme des Diagrammtyps „Zeitleistentabelle“.
Einschränkungen
Die Anzeige von Nullwerten wird derzeit für die folgenden Diagrammeinstellungen nicht unterstützt:
Metrik | Attribute | Diagrammtypen |
|---|---|---|
Geplante Inspektionen | Status (Inspektionen, Aktionen und Probleme) | Kuchen |
Abgeschlossene Inspektionen (Geplant) | Fragen (Inspektionen) | Wählen |
Seite / Abschnitt / Frage (Inspektionen) | Typ (Aktionen) | |
Priorität (Aktionen und Probleme) | ||
Typ (Aktionen) |
Häufig gestellte Fragen
Ein Strich steht für die Nullwerte aller nicht zählbaren Metriken. Wenn Sie beispielsweise ein Diagramm mit „Durchschnittliche Bewertung“ als Metrik erstellen, steht ein Strich für Datenpunkte, für die keine Daten erstellt wurden, während eine Null die tatsächliche Bewertung widerspiegelt.
War diese Seite hilfreich?
Vielen Dank für Ihre Anmerkungen.