- SafetyCulture nutzen
- Analysen
- Messwerte und Attribut eines Diagramms konfigurieren
Messwerte und Attribut eines Diagramms konfigurieren
In diesem Arikel erfahren Arikel erfahren Sie, wie Sie die Metriken und Attribute für Ihr Analyse-Diagramm mithilfe der Web-App konfigurieren können.Messwerte und Attribut eines Diagramms konfigurieren
Select
Analysen in the sidebar or select it in
Mehr.
Click
on the upper-right corner of the chart.
Click the dropdown menu under “Metric” and select the metric depending on the type of data you want to report on.
If you're creating a new chart, click
Messeinheit auswählen to add one.
Click the dropdown menu under "Attribute" to select the relevant attribute for your metric.
Click Diagramm speichern on the upper-right of the page to save the changes to the chart.
Click Speichern on the upper-right of the page to save the changes to your dashboard.
Zur Zeit wird die Auswahl von Messwerten unter verschiedenen Datentypen für zweiachsige Diagramme nicht unterstützt. Zum Beispiel können in einem Zwei-Achsen-Diagramm nur Metriken aus dem Inspektionsdatensatz verwendet werden.
Häufig gestellte Fragen
In der Analysen-Funktion gelten folgende Definitionen:
Eine Metrik ist ein Messwert oder eine Berechnung von Daten, die für ein Diagramm ausgewählt wurde, z. B. die Dauer von Inspektionen oder die Anzahl von Aktionen.
Ein Attribut ist ein Element, nach dem Sie Ihre Metrik aufschlüsseln können, um mehr Erkenntnisse zu gewinnen. Attribute, wie z. B. Inspektionsdatum, können ausgewählt werden, um Metriken auf unterschiedliche Weise zu gruppieren.
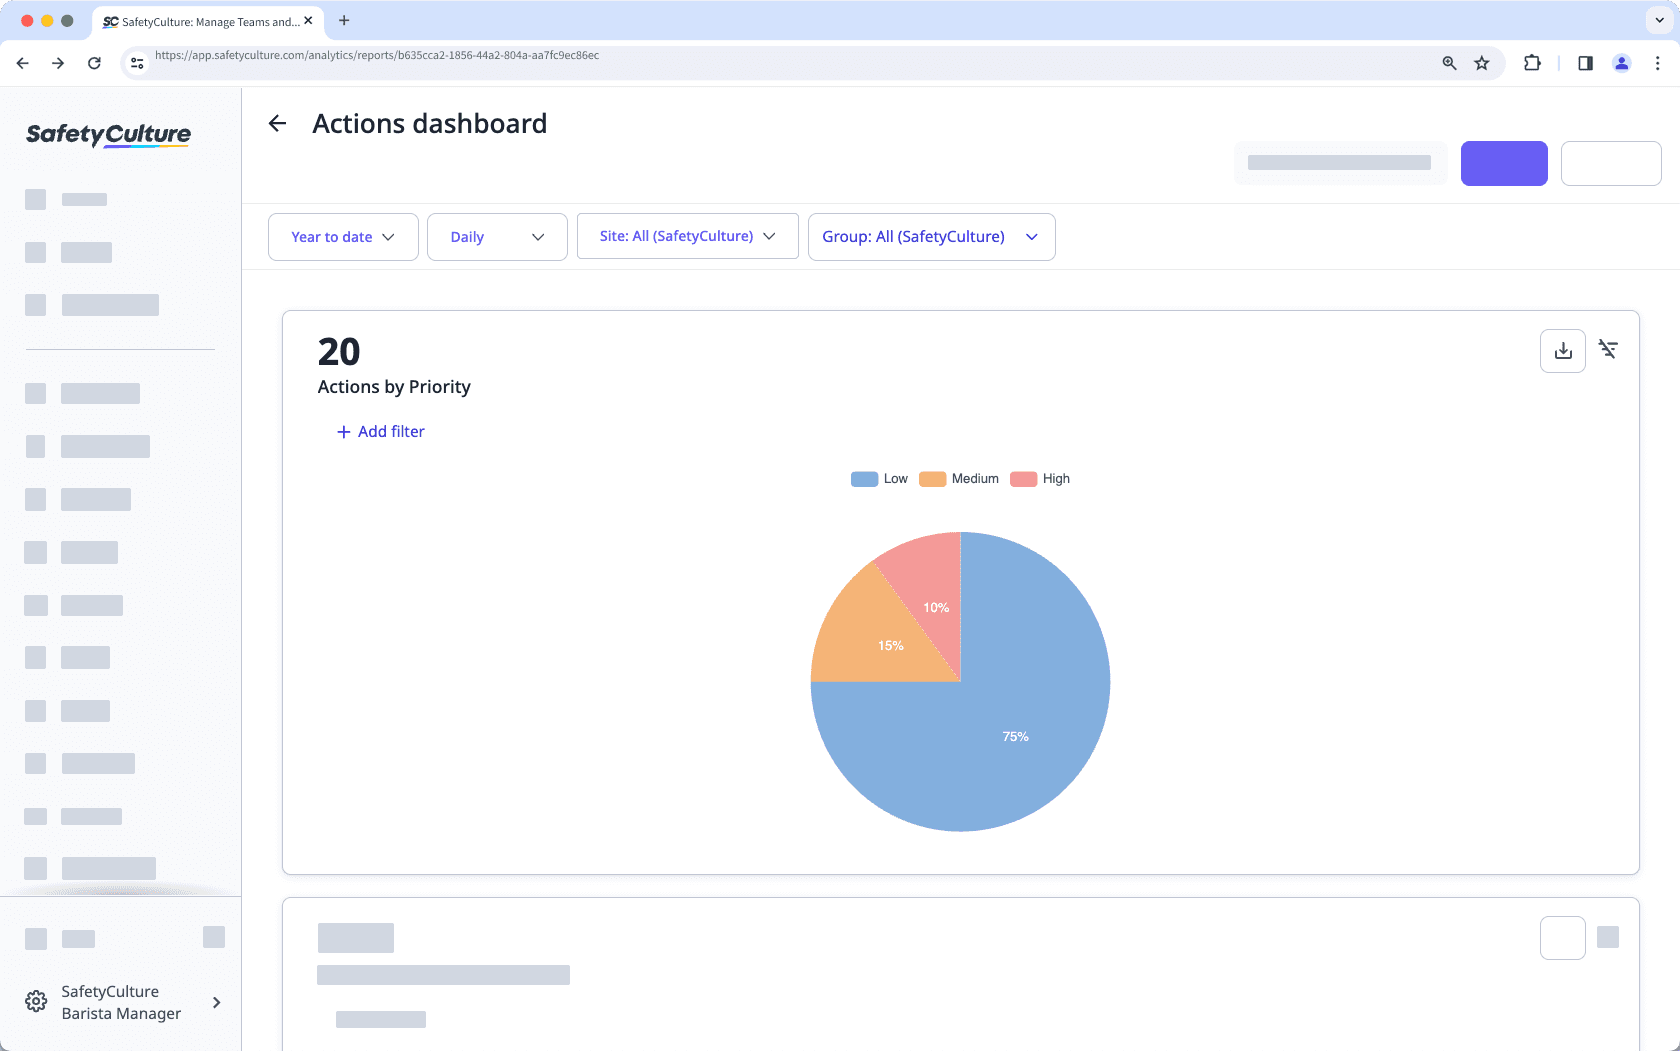
Im folgenden Beispiel ist "Aktionen" der Messwert, der durch das Attribut "Priorität" gruppiert wird.

Es kann daran liegen, dass in einem der Diagramme zweimal dieselbe Metrik oder dasselbe Attribut ausgewählt ist. Jede Metrik oder jedes Attribut kann nur einmal in einem Diagramm ausgewählt werden.
War diese Seite hilfreich?
Vielen Dank für Ihre Anmerkungen.