Diagrammtitel hinzufügen oder bearbeiten
Erfahren Sie, wie Sie Diagrammtitel über die Web-App hinzufügen oder bearbeiten können, um Stakeholdern einen klaren Kontext zu bieten und die Lesbarkeit komplexer Analytics-Dashboards zu verbessern.Warum sollte ich Diagrammtitel verwenden?
Diagrammtitel sind anpassbare Beschriftungen für Diagramme in Analytics Dashboards , die beschreiben, was jedes Diagramm darstellt. Wenn Ihr Unternehmen mehr Daten verfolgt und mehr Diagramme hinzufügt, erleichtern Titel die Organisation komplexer Dashboards und die klare Unterscheidung zwischen ähnlichen Metriken, was besonders hilfreich ist, wenn:
Überprüfung komplexer Dashboards mit mehreren Datenpunkten.
Dashboards freigeben mit Teammitgliedern.
Zusammenarbeit mit Stakeholdern, die möglicherweise nicht mit der Datenstruktur vertraut sind.
Klare Diagrammtitel verringern das Risiko, dass Daten bei Überprüfungen falsch interpretiert werden, und sorgen dafür, dass Erkenntnisse auf einen Blick verständlich sind. Sie können beispielsweise Titel verwenden, um zwischen Diagrammen wie "Inspektionen nach Standort" und "Inspektionen nach Vorlage" zu unterscheiden, damit Teams Trends sicher analysieren und schneller fundierte Entscheidungen treffen können.

Diagrammtitel hinzufügen
Wählen Sie
Analysen in der Seitenleiste oder in
Mehr aus.
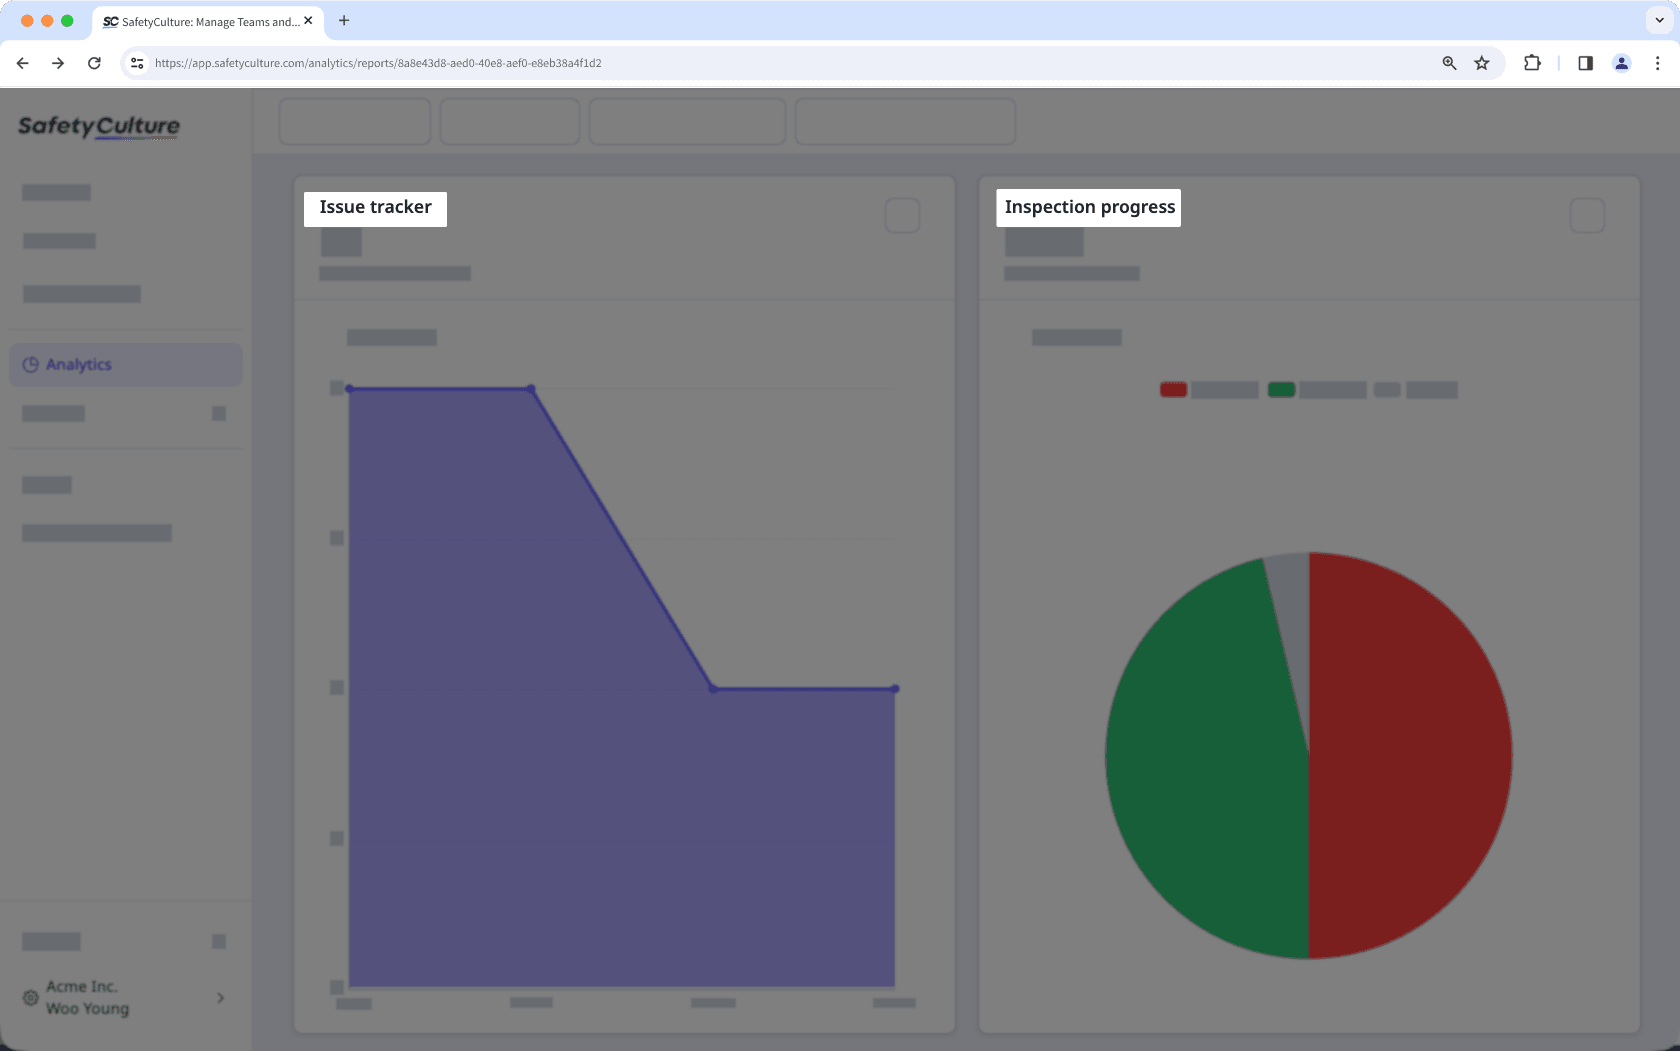
Klicken Sie oben rechts auf dem Diagramm auf
.
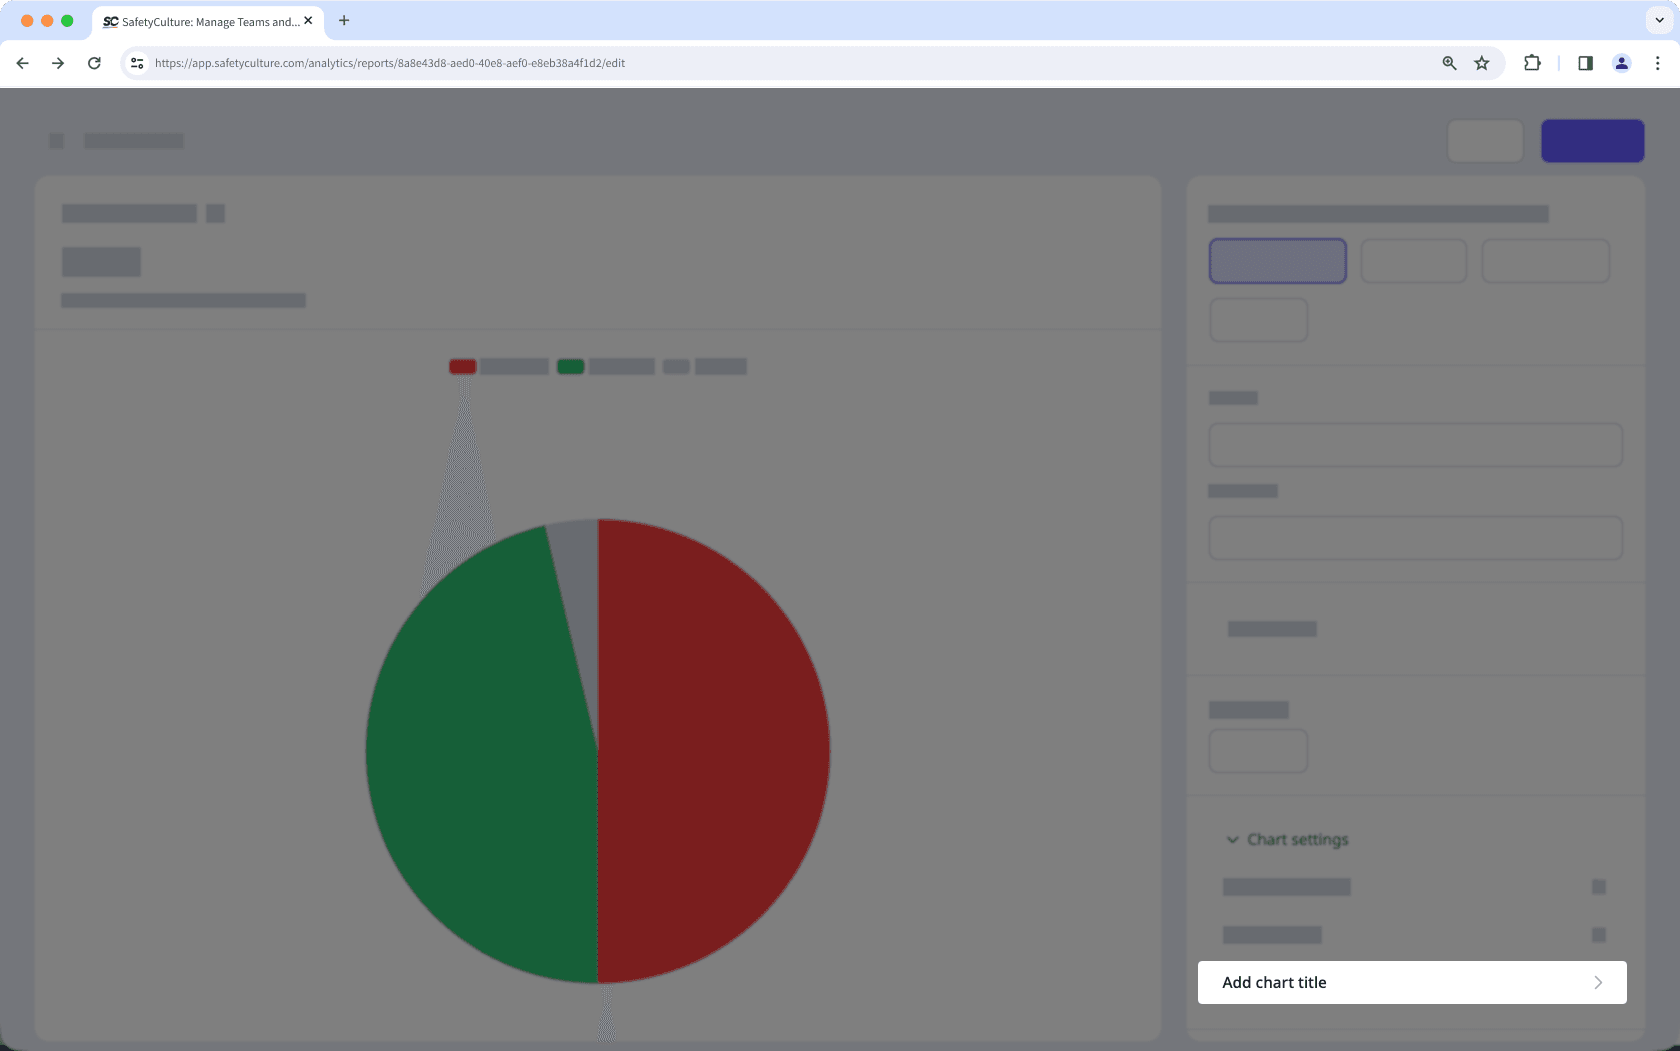
Klicken Sie auf Diagramm-Einstellungenund wählen Sie dann Diagrammtitel hinzufügen.

Klicken Sie oben rechts auf der Seite auf Diagramm speichern.
Klicken Sie oben rechts auf der Seite auf Speichern.
Einen Diagrammtitel bearbeiten
Wählen Sie
Analysen in der Seitenleiste oder in
Mehr aus.
Klicken Sie oben rechts auf dem Diagramm auf
.
Klicken Sie auf
oben links im Diagramm, drücken Sie dann eingeben oder zurück auf Ihrer Tastatur oder klicken Sie irgendwo im Diagrammersteller.
Klicken Sie oben rechts auf der Seite auf Diagramm speichern.
Klicken Sie oben rechts auf der Seite auf Speichern.
War diese Seite hilfreich?
Vielen Dank für Ihre Anmerkungen.