How does inspection performance work in Analytics?
Inspection performance in Analytics helps you understand how your team is performing inspections over time. It surfaces average scores across your inspections so you can quickly assess how well teams are meeting expectations. By tracking performance trends, you can pinpoint areas that may need extra support, identify recurring issues, and take action to improve quality and compliance. This ultimately makes it easier to drive accountability and support continuous improvement across your operations.
What you'll need
The data you can view is the same as what you have access to in SafetyCulture. Learn how to give yourself access to the relevant data or assign yourself "Override permissions: View all data" permission for visibility across all data in your organization.
How does scoring in Analytics work?
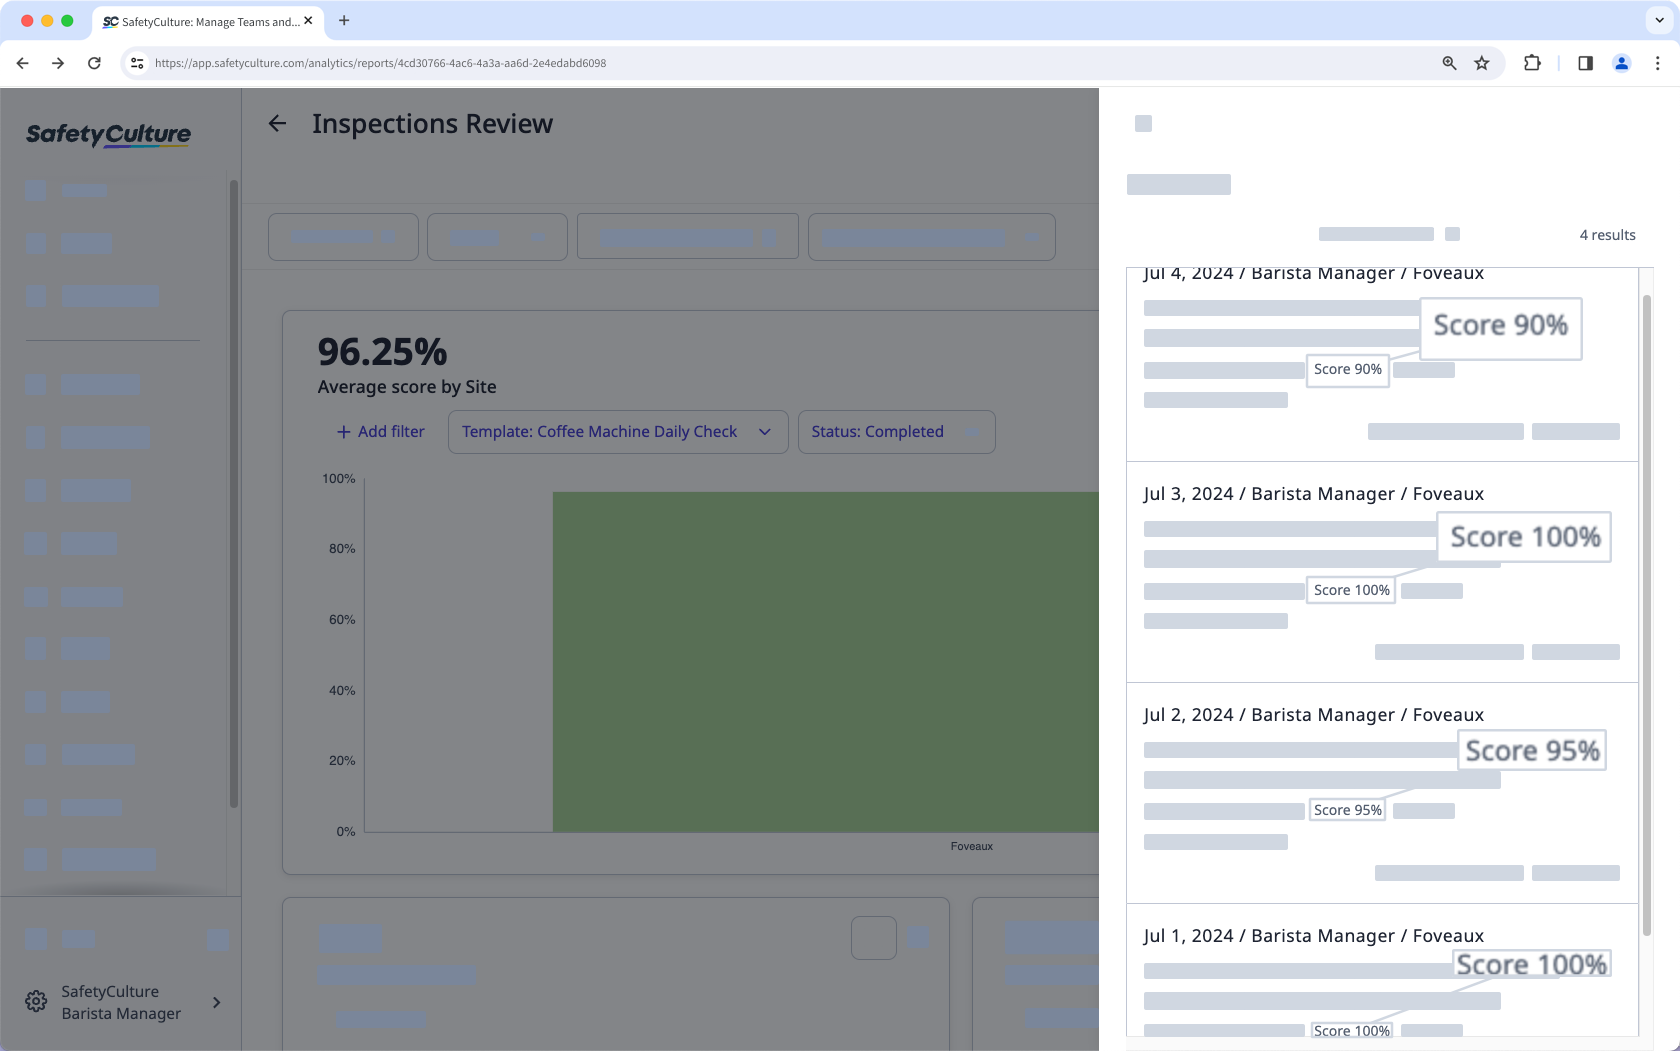
The average score in New Analytics is calculated by adding up all the score percentages and then dividing by the number of inspections.
For example, if you have 4 inspections with scores of 90%, 100%, 95%, and 100%, the average score is calculated like this:
(90+100+95+100)/4 = 96.25%
You need to set up scoring in your templates to capture and track question or item scores in your organization.
View inspection performance
Select Analytics in the sidebar or select it in More.
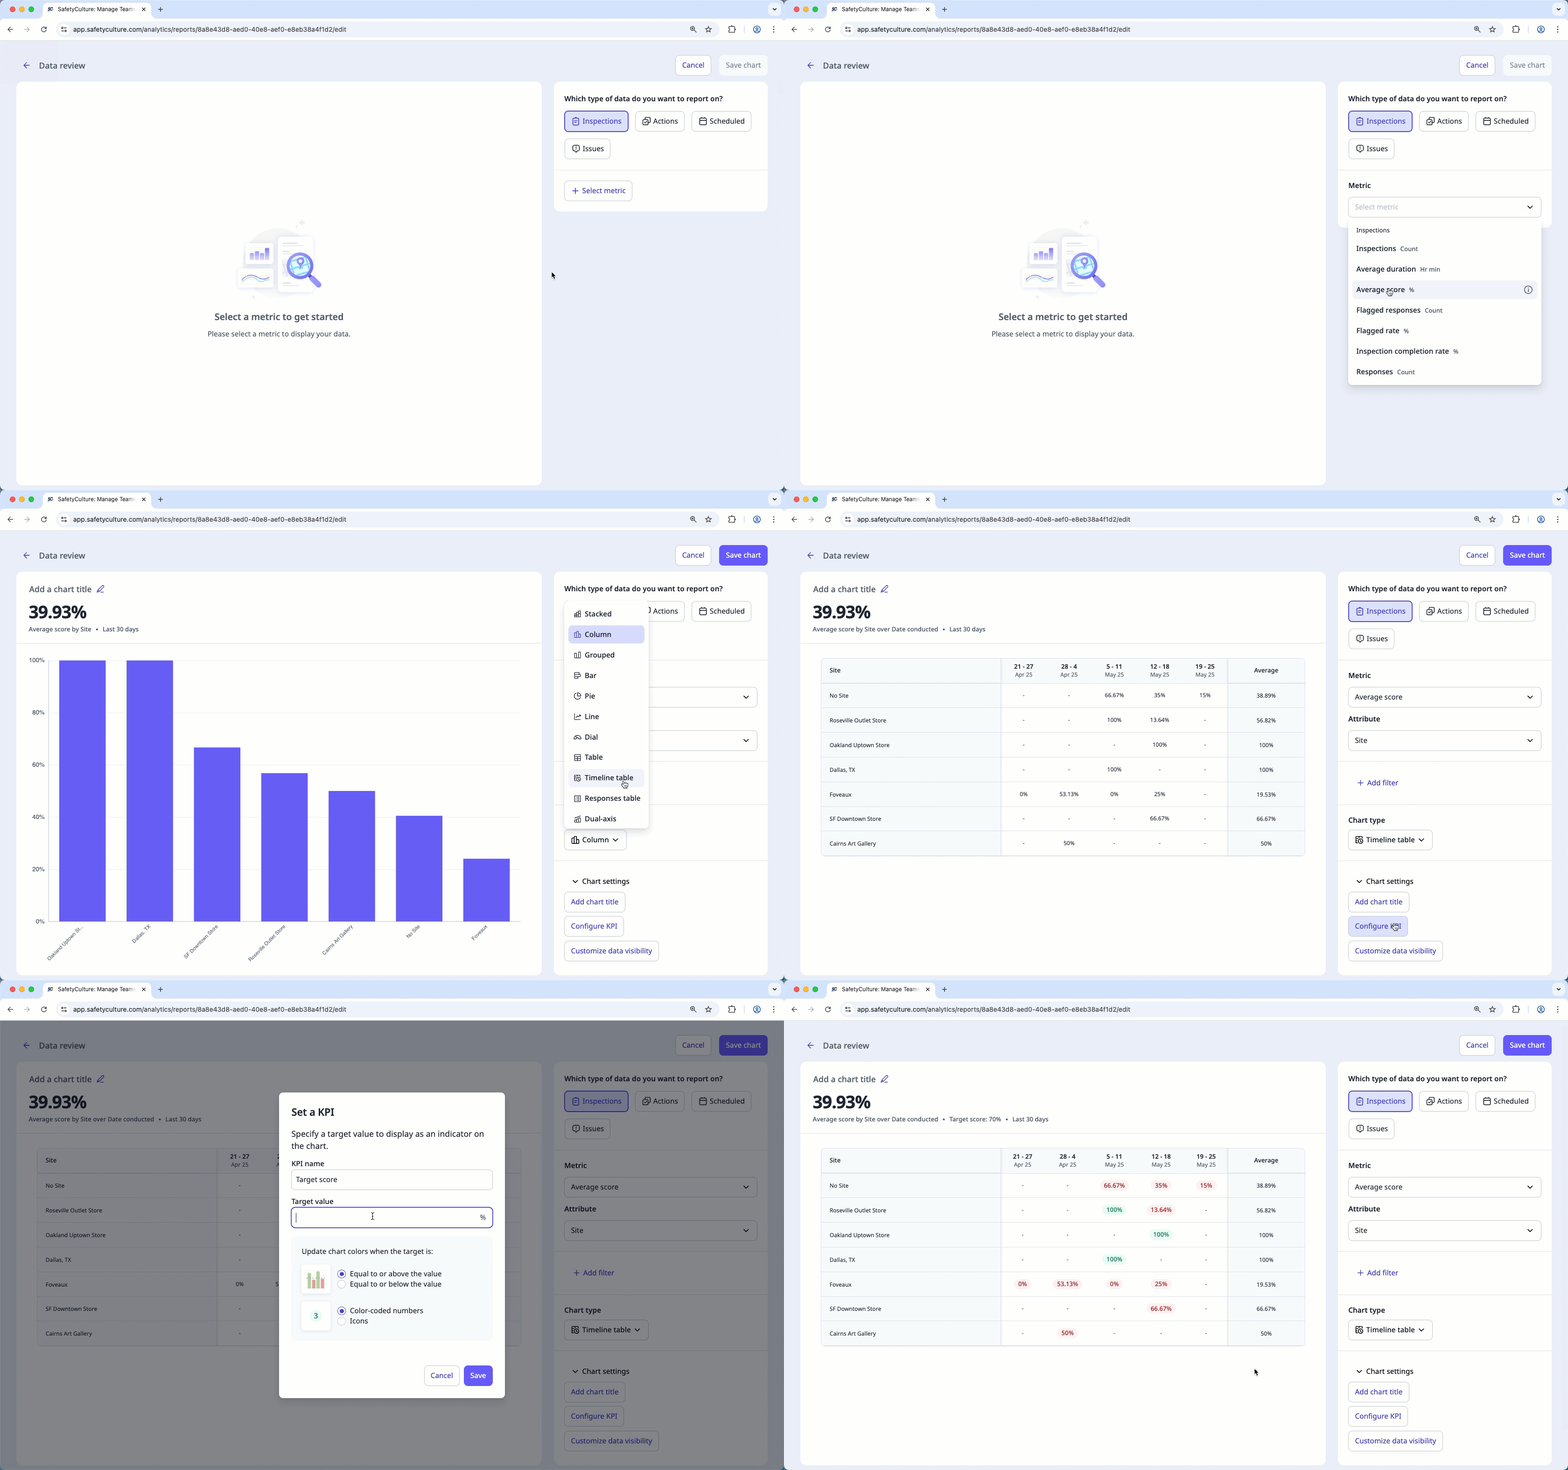
Click Add chart on the upper-right of the page, and select Add custom chart.
In the chart builder, configure the chart as follows:
Data type: Select Inspections from the upper-right of the page.
Metric: Select Average score from the dropdown.
Configure your chart accordingly.
Click Save chart on the upper-right of the page to save the changes to the chart.
Click Save on the upper-right of the page to save the changes to your dashboard.
You can track inspection scores across pages, sections, and questions by using the Timeline table chart type.