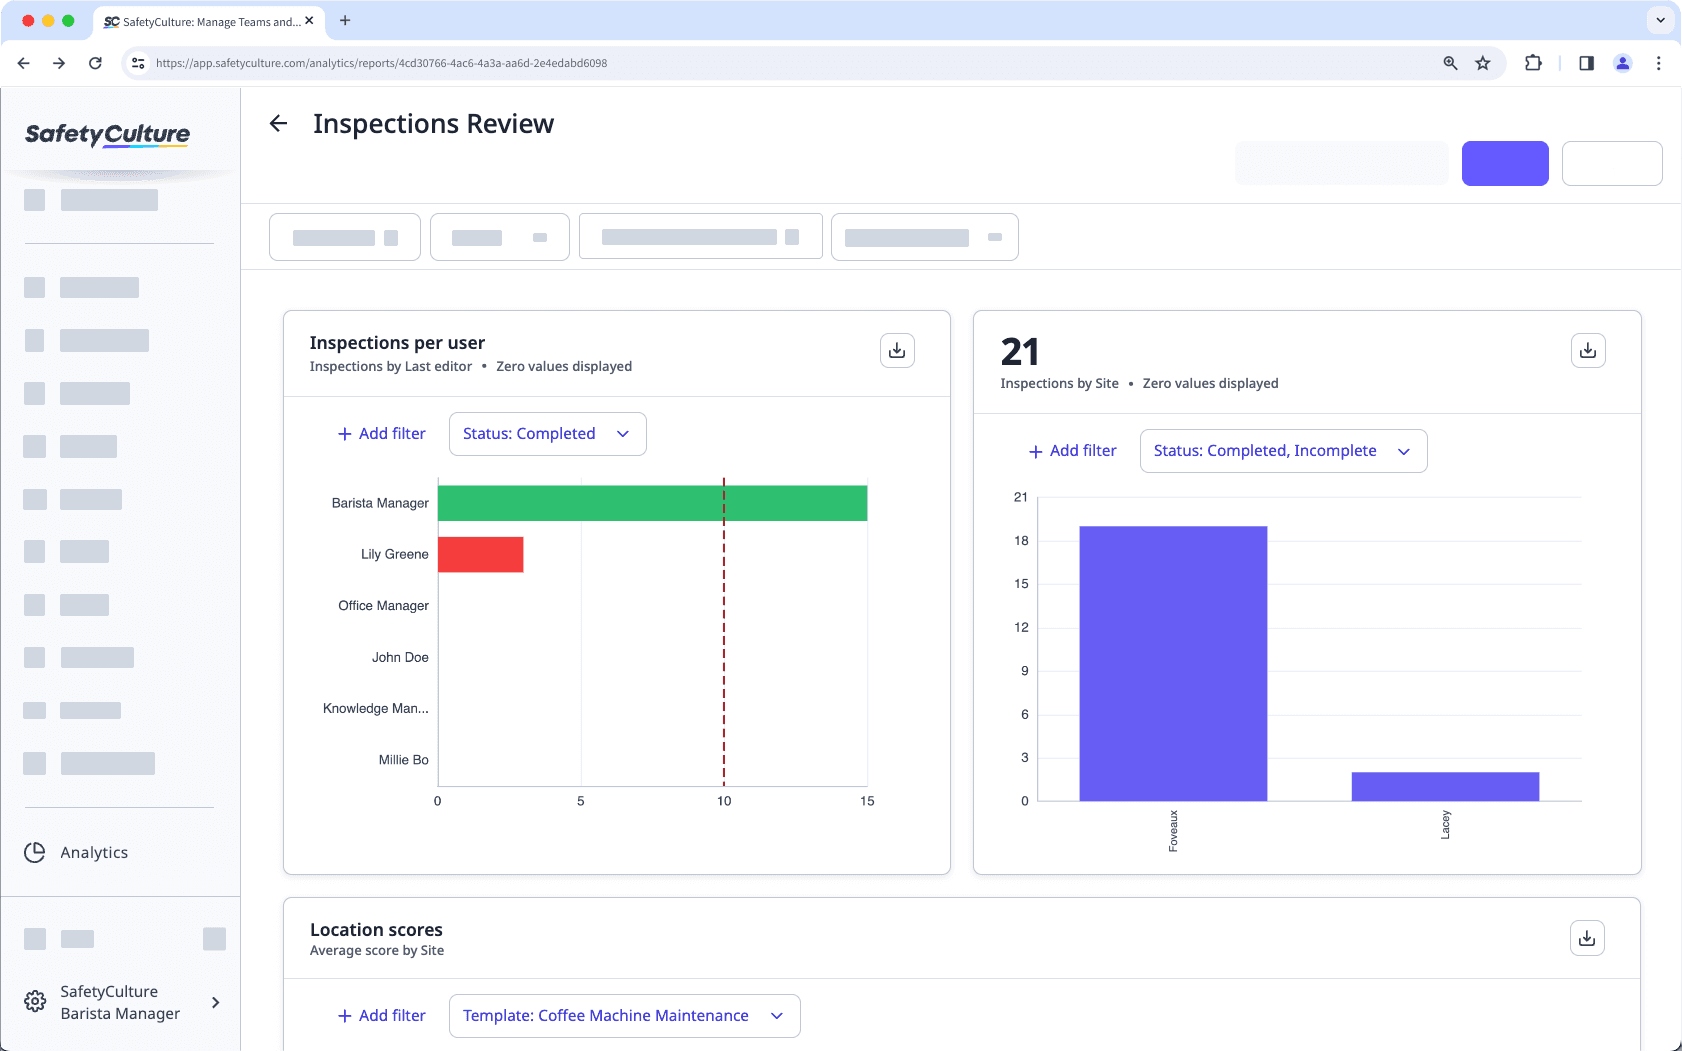
Personalizar la visibilidad de los datos de un gráfico de Estadísticas
Configure la visibilidad de los datos para los gráficos de Estadísticas en la aplicación web para mostrar u ocultar solo la información relevante en los paneles.¿Qué significa personalizar la visibilidad de los datos?
Para aprovechar al máximo sus paneles de Estadísticas, es esencial tener control sobre los datos que elige mostrar. Personalizar la visibilidad de los datos en los gráficos le permite mostrar u ocultar valores a cero, lo que permite generar informes basados en excepciones para destacar los éxitos de su equipo e identificar áreas de mejora.
Además, puede ocultar el recuento total de métricas de sus gráficos, lo que reduce aquello irrelevante en sus paneles y garantiza que se destaque la información más relevante. Este nivel de personalización mejora la claridad y permite a su equipo centrarse en lo que realmente importa.

Las métricas sin recuento como "Duración promedio", "Puntuación promedio", etc. mostrarán valores a cero de forma predeterminada.
Personalizar la visibilidad de los datos de un gráfico
Seleccione
Estadísticas en la barra lateral o selecciónelo en
Más.
Haga clic en Guardar en la esquina superior derecha de la página.
En el panel lateral, haga clic en Ajustes de gráficos y seleccione Visibilidad de datos.
En el panel lateral, active o desactive los ajustes de visibilidad de datos según sea necesario.
Mostrar elementos con valores cero: muestre u oculte los valores en los que no se han creado datos.
Ocultar métrica total por encima del gráfico: muestre u oculte el recuento total en función de la métrica y el atributo configurados en la parte superior izquierda del gráfico.
Haga clic en Guardar gráfico en la parte superior derecha de la página para guardar los cambios en el gráfico.
Haga clic en Guardar en la parte superior derecha de la página para guardar los cambios en su panel.
En el caso de los gráficos con varios atributos configurados, solo se muestran valores a cero para el primer atributo, excepto para el tipo de gráfico de "Cuadro cronológico".
Limitaciones
La visualización de valores cero no es compatible actualmente con los siguientes ajustes de gráficos:
Métricas | Atributos | Tipos de gráficos |
|---|---|---|
Inspecciones programadas | Estado (Inspecciones, Acciones y Contratiempos) | Sector |
Inspecciones completadas (Programadas) | Pregunta (Inspecciones) | Medidor radial |
Página / Sección / Pregunta (Inspecciones) | Tipo (Acciones) | |
Prioridad (Acciones y Contratiempos) | ||
Tipo (Acciones) |
Preguntas frecuentes
Un guion representa los valores a cero para todas las métricas que no cuentan. Por ejemplo, si crea un gráfico con la métrica de "Puntuación promedio", un guion representará los puntos de datos en los que no se crean datos, mientras que un cero reflejará la puntuación real.
¿Esta página le fue de ayuda?
Gracias por hacérnoslo saber.