- Usar SafetyCulture
- Estadísticas
- Configurar métricas y atributos de gráficos
Configurar métricas y atributos de gráficos
Aprenda a configurar métricas y atributos para sus gráficos de Estadísticas a través de la aplicación web.Configurar la métrica y el atributo de un gráfico
Select
Estadísticas in the sidebar or select it in
Más.
Click
on the upper-right corner of the chart.
Click the dropdown menu under “Metric” and select the metric depending on the type of data you want to report on.
If you're creating a new chart, click
Seleccionar métrica to add one.
Click the dropdown menu under "Attribute" to select the relevant attribute for your metric.
Click Guardar gráfico on the upper-right of the page to save the changes to the chart.
Click Guardar on the upper-right of the page to save the changes to your dashboard.
Actualmente, no se admite la selección de métricas de diferentes tipos de datos para gráficos de dos ejes. Por ejemplo, solo las métricas del conjunto de datos de Inspecciones se pueden utilizar en un gráfico de dos ejes.
Preguntas frecuentes
En la función de Estadísticas:
Una métrica es la medida o el cálculo de los datos seleccionados para un gráfico, como la duración de la inspección o el número de acciones.
Un atributo es un elemento por el cual puede desglosar su métrica para obtener más información. Los atributos, como la fecha de la inspección, se pueden seleccionar para agrupar métricas de diferentes maneras.
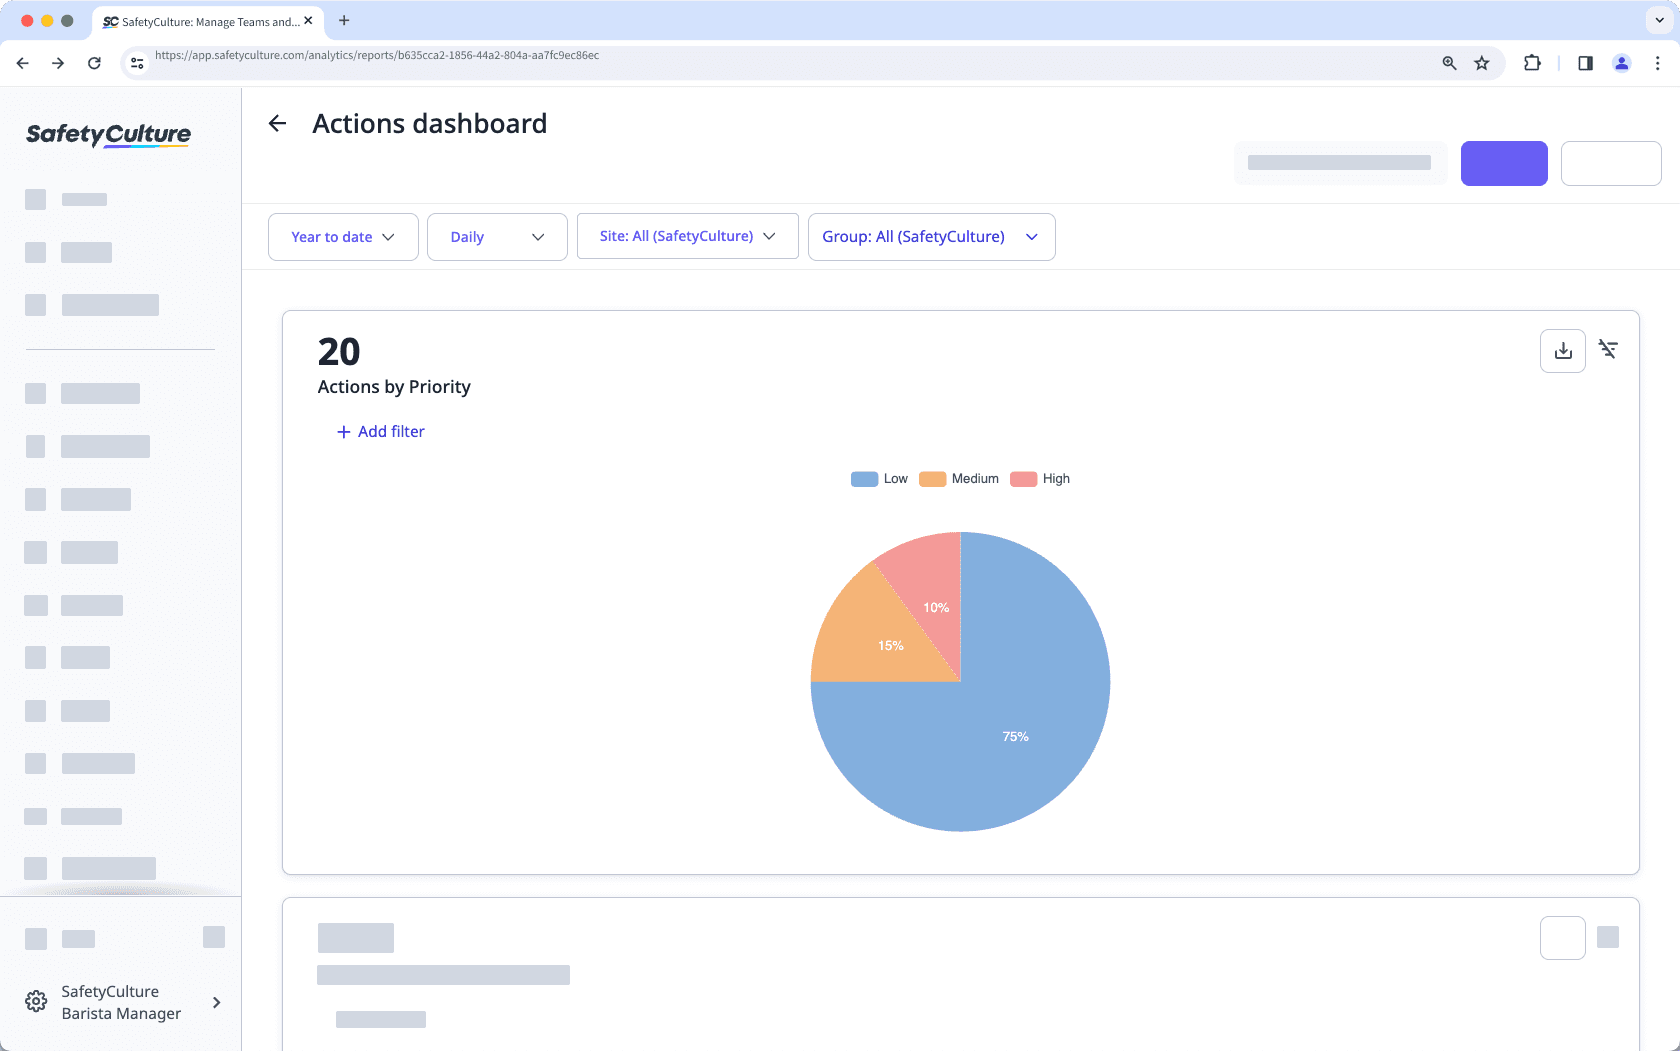
En el siguiente ejemplo, "Acciones" es la métrica, que está agrupada por el atributo de "Prioridad".

Puede ser porque uno de los gráficos tiene seleccionados dos métricas o atributos iguales. Cada métrica o atributo solamente se puede seleccionar una vez en cada gráfico.
¿Esta página le fue de ayuda?
Gracias por hacérnoslo saber.