¿Por qué utilizar títulos en los gráficos?
Los títulos de los gráficos son etiquetas personalizables para los gráficos en paneles de Estadísticas que ayudan a describir lo que representa cada gráfico. A medida que su organización rastrea más datos y añade más gráficos, los títulos facilitan la organización de paneles complejos y la diferenciación clara entre métricas similares, lo cual es especialmente útil al:
Revisar paneles complejos con varios puntos de datos.
Compartir paneles con miembros del equipo.
Colaborar con partes interesadas que pueden no estar familiarizadas con la configuración de los datos.
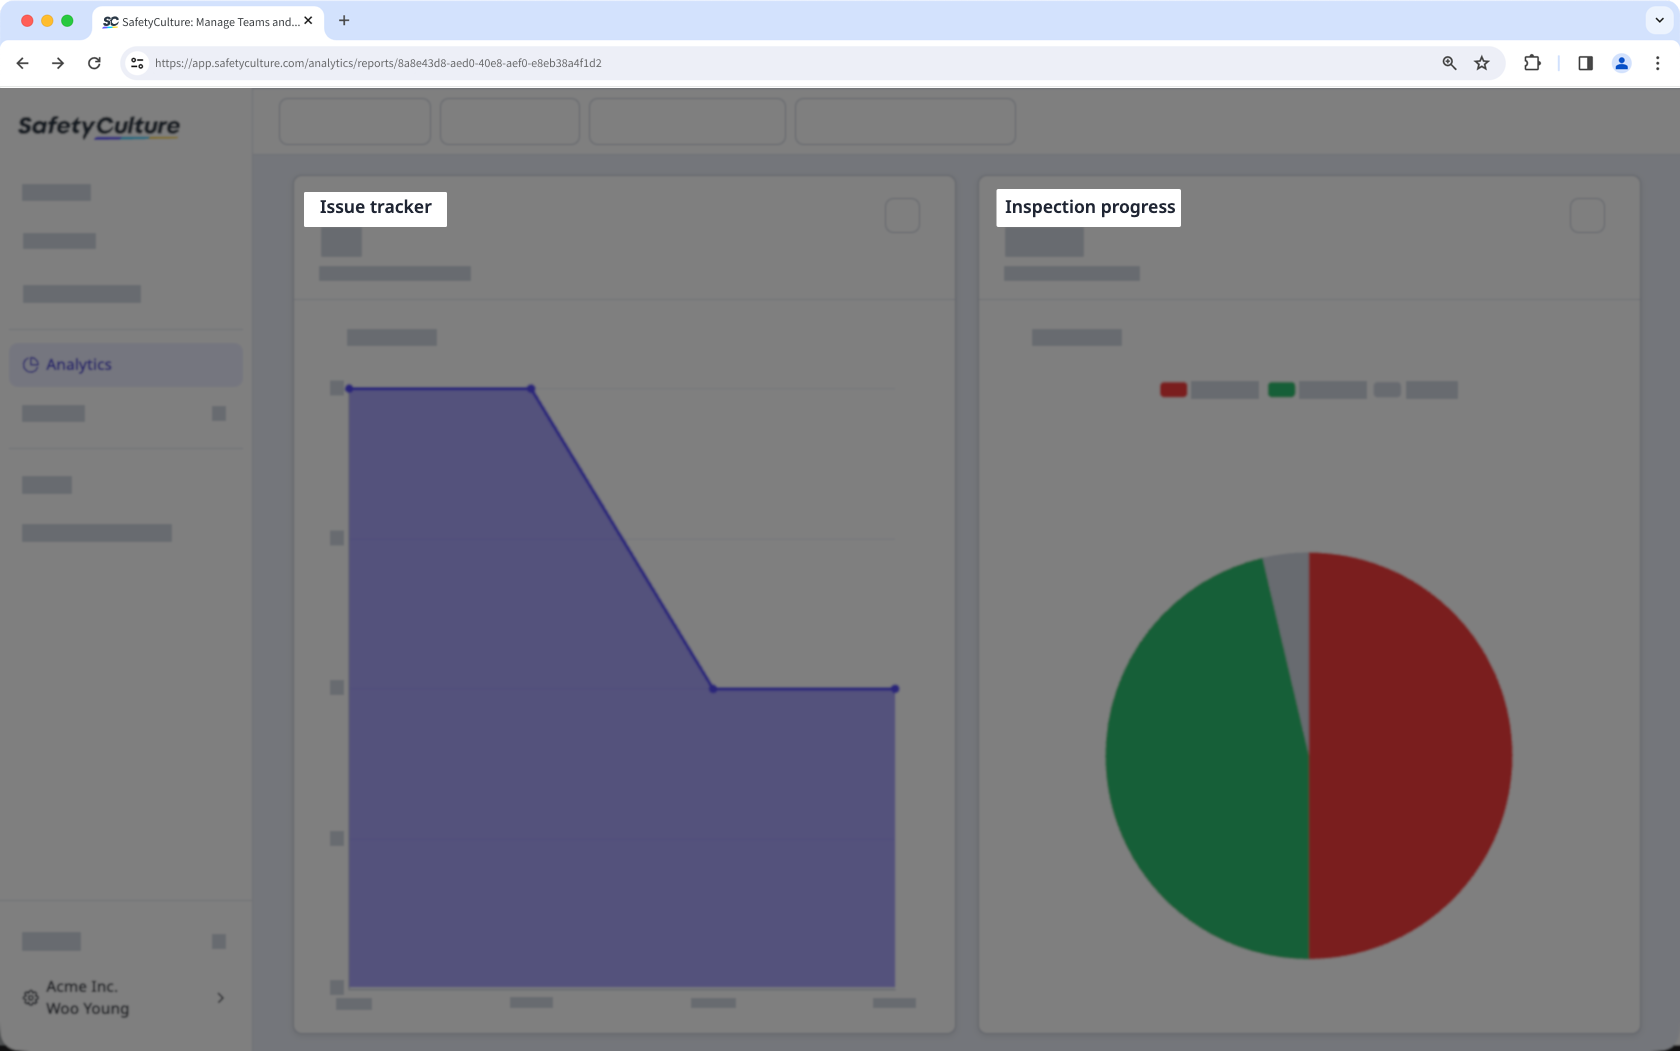
La claridad en los títulos de los gráficos reduce el riesgo de malinterpretar los datos durante las revisiones y garantiza que la información se comprenda a simple vista. Por ejemplo, puede usar títulos para distinguir entre gráficos como "Inspecciones por sitio" e "Inspecciones por plantilla", lo que ayuda a los equipos a analizar las tendencias con confianza y a tomar decisiones informadas con mayor rapidez.
Lo que necesitarás
Añadir un título del gráfico
Seleccione Estadísticas en la barra lateral o selecciónelo en Más.
Haga clic en Guardar en la esquina superior derecha de la página.
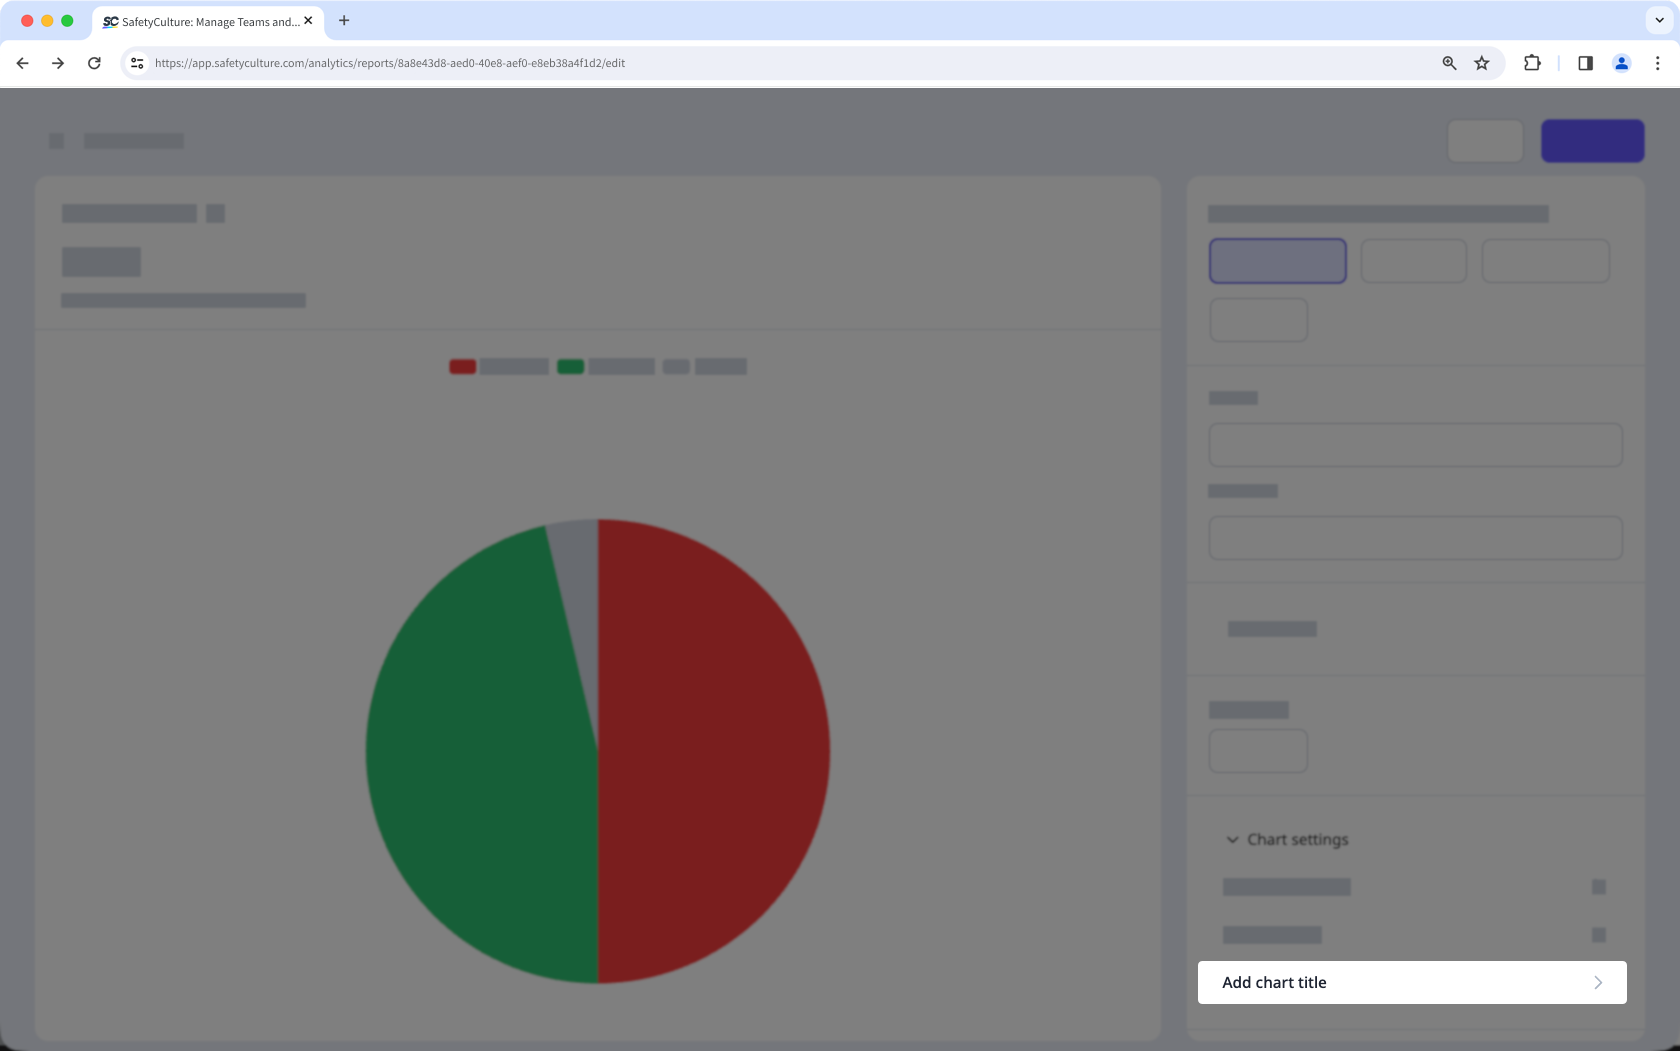
Haga clic en Ajustes de gráficos y seleccione Añadir título del gráfico.
Haga clic en Guardar gráfico en la parte superior derecha de la página.
Haga clic en Guardar en la parte superior derecha de la página.
Editar título de un gráfico
Seleccione Estadísticas en la barra lateral o selecciónelo en Más.
Haga clic en Guardar en la esquina superior derecha de la página.
Haga clic en en la parte superior izquierda del gráfico y, a continuación, pulse Tecla Enter o devolver en el teclado o haga clic en cualquier lugar del generador de gráficos.
Haga clic en Guardar gráfico en la parte superior derecha de la página.
Haga clic en Guardar en la parte superior derecha de la página.