- Using SafetyCulture
- Analytics
- Configure chart metrics and attributes
Configure chart metrics and attributes
Learn how to configure the metrics and attributes for your Analytics charts via the web app.Configure a chart's metric and attribute
Select
Analytics in the sidebar or select it in
More.
Click
on the upper-right corner of the chart.
Click the dropdown menu under “Metric” and select the metric depending on the type of data you want to report on.
If you're creating a new chart, click
Select metric to add one.
Click the dropdown menu under "Attribute" to select the relevant attribute for your metric.
Click Save chart on the upper-right of the page to save the changes to the chart.
Click Save on the upper-right of the page to save the changes to your dashboard.
Selecting metrics under different data types is not currently supported for dual-axis charts. For example, only metrics under the Inspections data set can be used in a dual-axis chart.
Frequently asked questions
In the Analytics feature:
A metric is the measurement or calculation of data that's selected for a chart, such as inspection durations or the number of actions.
An attribute is an element by which you can breakdown your metric to gain more insights. Attributes, such as inspection date, can be selected to group metrics in different ways.
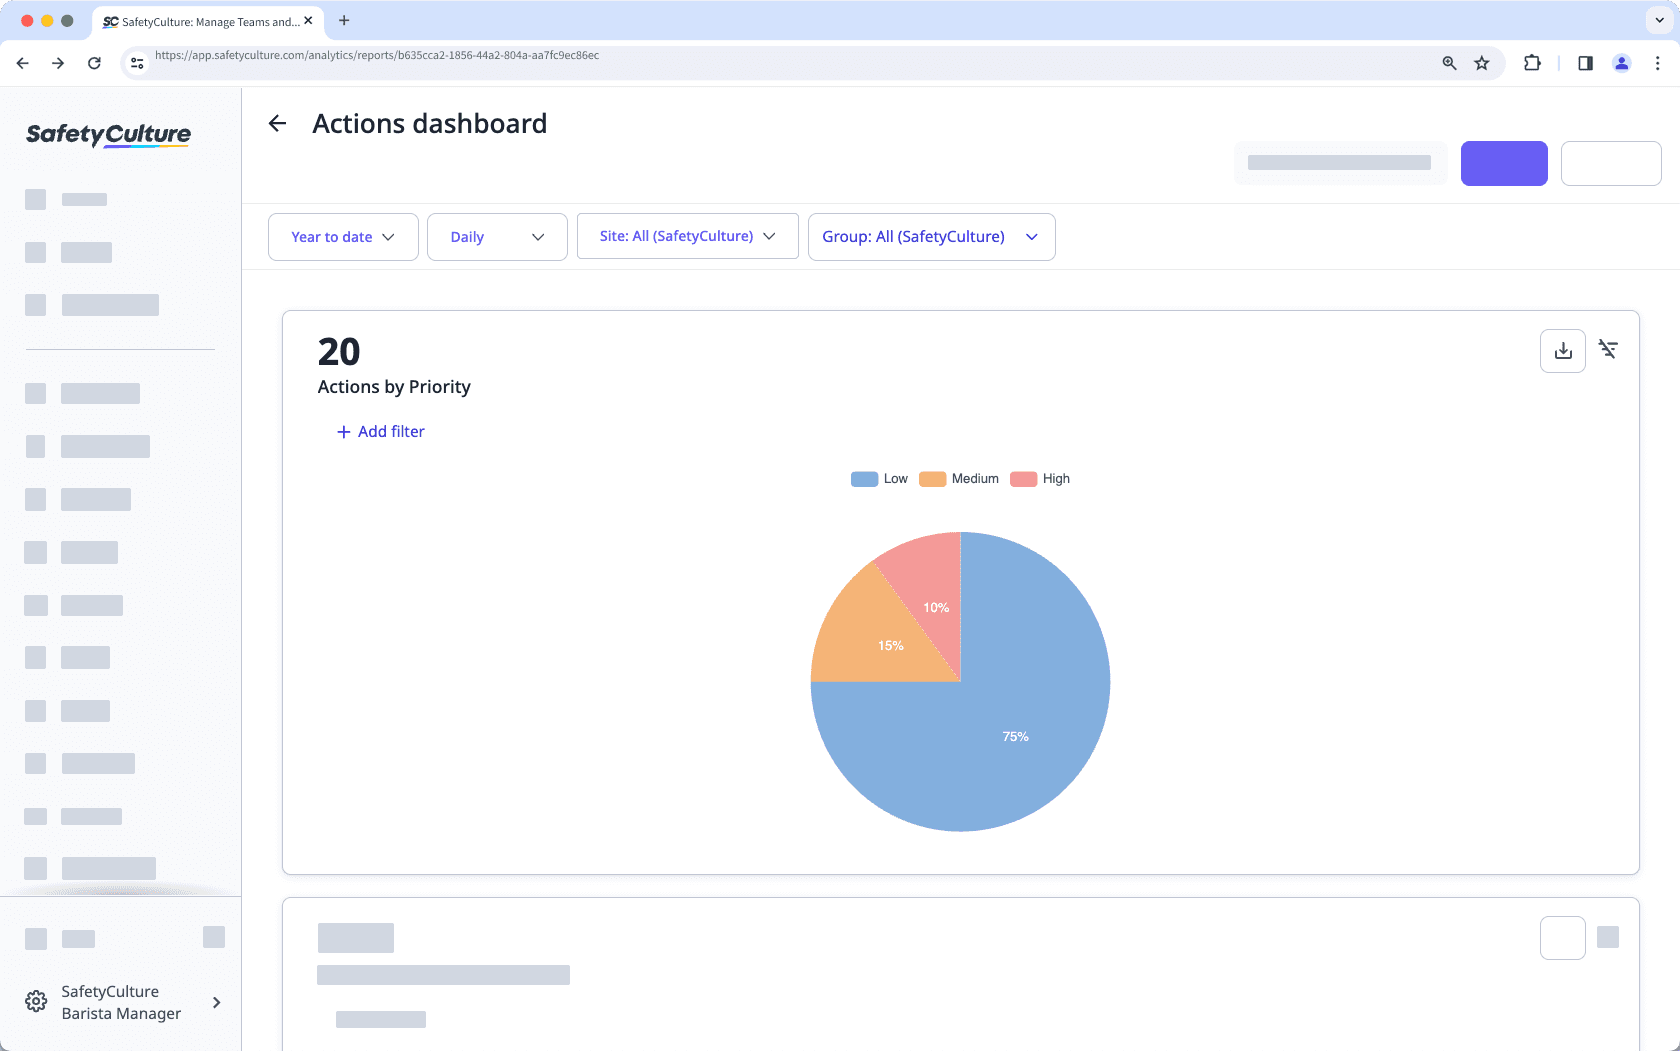
In the following example, "Actions" is the metric, which is grouped by the "Priority" attribute.

It may be because one of the charts has two of the same metric or attribute selected. Each metric or attribute can only be selected once in a chart.
Was this page helpful?
Thank you for letting us know.