- Using SafetyCulture
- Analytics
- Delete charts and dashboards
Delete charts and dashboards
Learn how to delete Analytics charts and dashboards for your organization via the web app.Delete a chart
Select
 Analytics from the menu on the left-hand side.
Click the dashboard.
Click
 Edit on the upper-right of the page.
Click
 on the upper-right of the chart and select
  Delete.
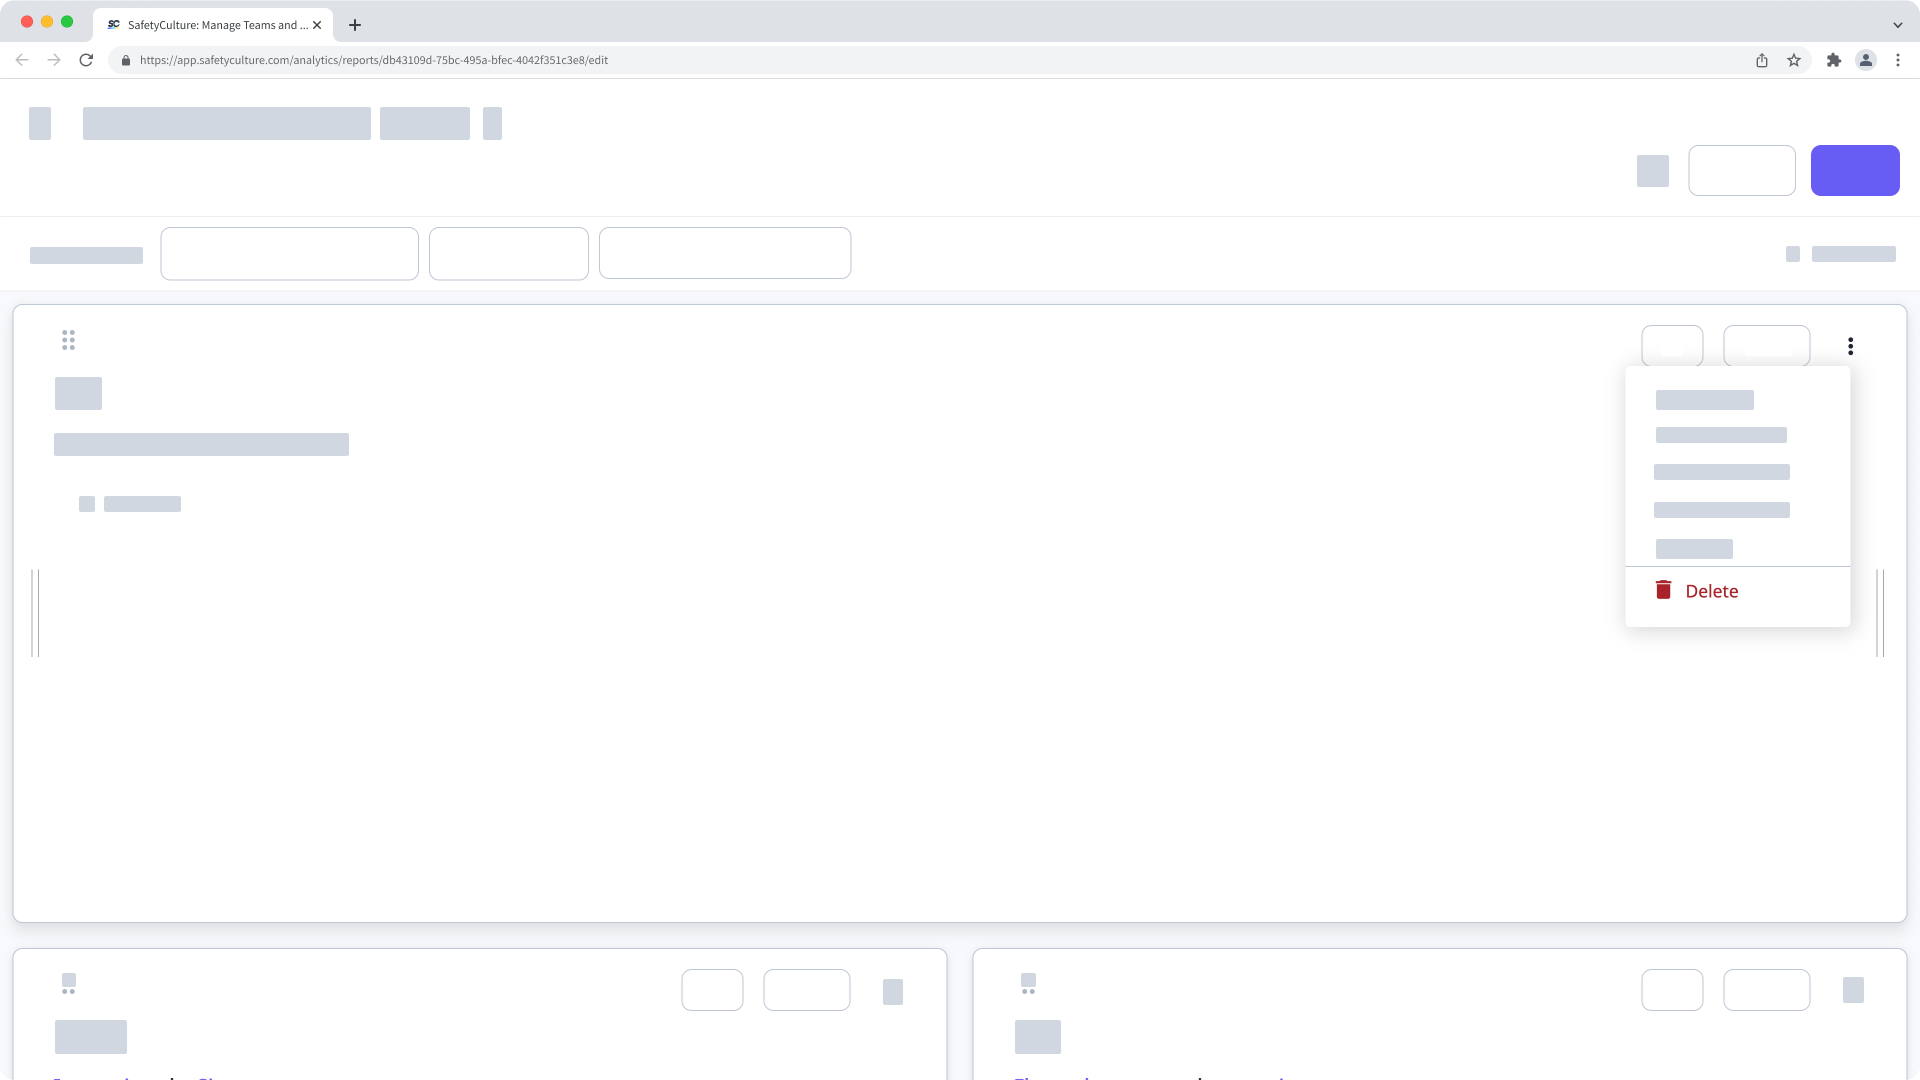
Click Save on the upper-right of the page.
Delete a dashboard
Select
Analytics from the menu on the left-hand side.Click
on the dashboard's right-hand side, then click Delete.
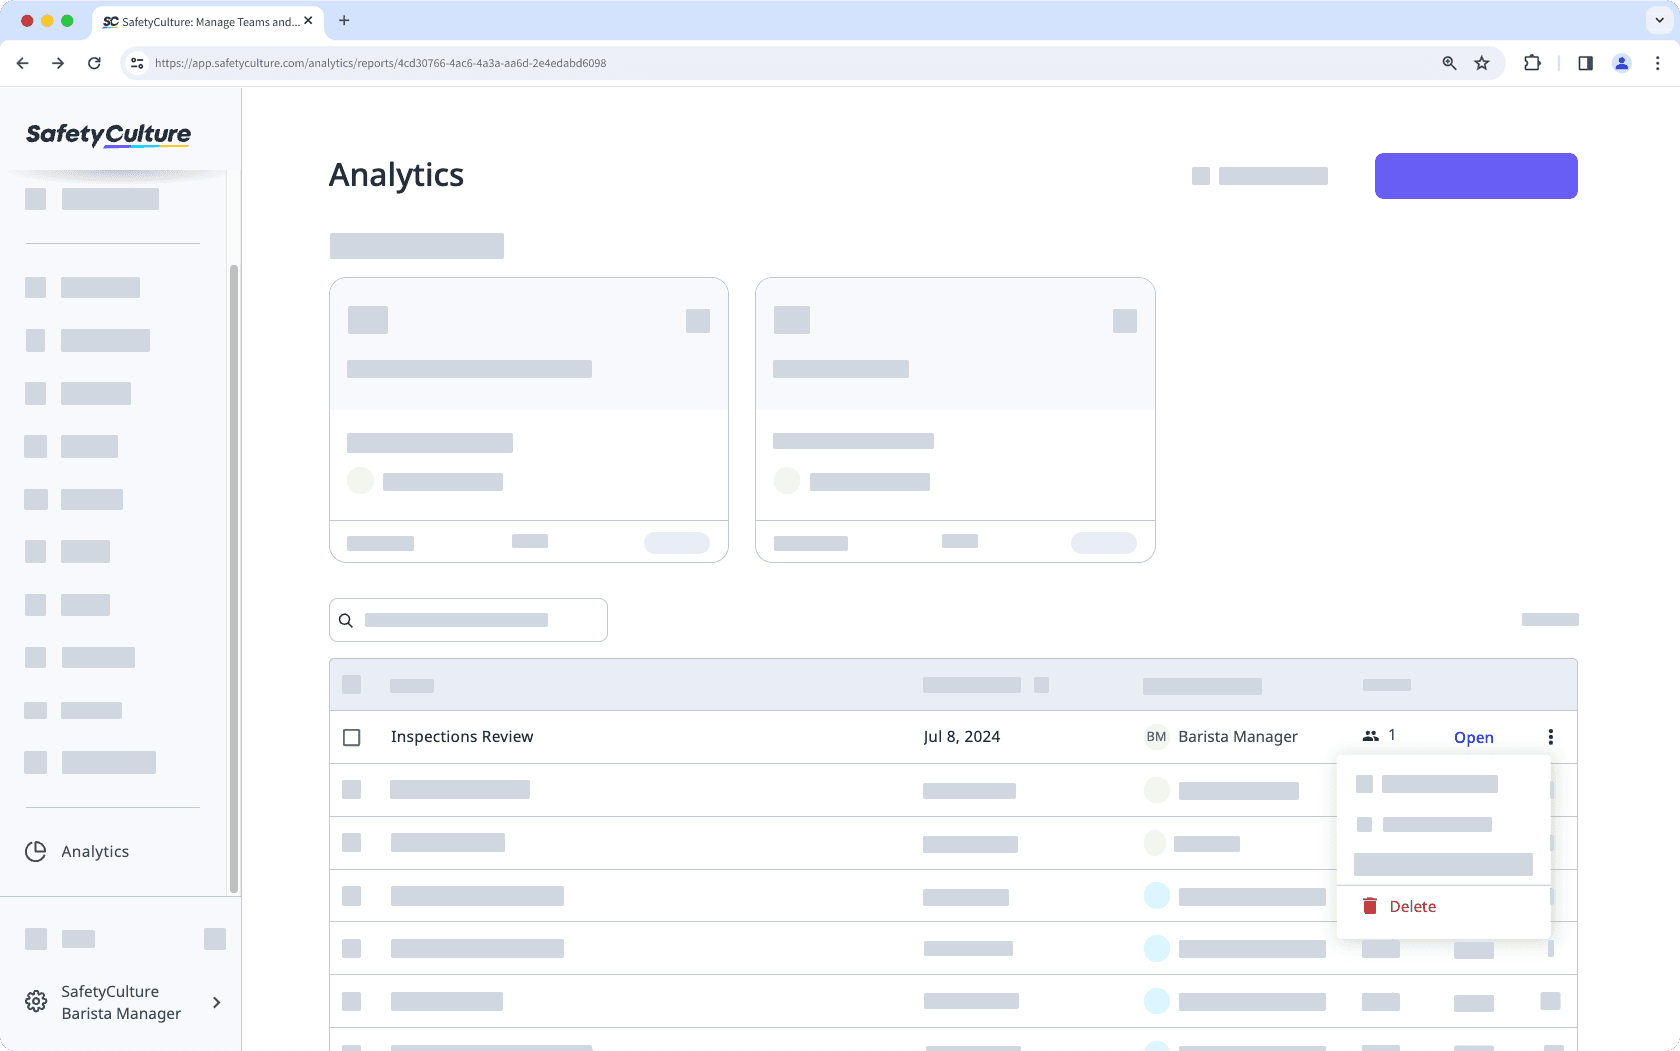
In the pop-up window, click Delete.
Need more help?
Was this page helpful?
Thank you for letting us know.
In this article