Wie funktioniert Brain Boost?
Brain Boost ist eine Funktion in SafetyCulture-Schulungen, die Ihrem Team hilft, wichtiges Wissen durch kurze, individuell angepasste Quizfragen zu behalten. Diese Quizfragen werden automatisch 24 Stunden, nachdem ein Teammitglied eine Frage aus einem Kurs, den Sie für Brain Boost ausgewählt haben, beantwortet hat, gesendet. Ziel ist es, das Gedächtnis zu stärken, indem die Informationen kurz vor dem Vergessen noch einmal überprüft werden.
Der Zeitplan für jedes Quiz basiert auf dem SM-2-Algorithmus. Wenn ein Teammitglied eine Frage falsch beantwortet, wird sie ihm häufiger angezeigt. Je öfter eine Frage richtig beantwortet wird, desto seltener wird sie angezeigt, was dazu beiträgt, dass die Antworten sich langfristig einprägen. Die Tabelle zeigt, wie der Abstand zwischen den Wiederholungen mit jeder richtigen Antwort zunimmt:
Anzahl der Male, die eine Frage nacheinander richtig beantwortet wird | Wann die Frage erneut gestellt wird |
|---|---|
0 Mal | Am nächsten Tag |
1 Mal | 3 Tage nach dem letzten Quiz |
2 Mal | 10 Tage nach dem letzten Quiz |
3 Mal | 30 Tage nach dem letzten Quiz |
4 Mal | 60 Tage nach dem letzten Quiz |
5 Mal | Es wird nicht mehr angezeigt |
Sie können auch die Brain Boost-Analysen Ihres Teams anzeigen, um zu sehen, wie gut sie sich die Informationen merken und sich mit den Quizfragen im Laufe der Zeit beschäftigen.
Was Sie brauchen
Die Synchronisierung und Aktualisierung von Spaced Repetition-Daten kann bis zu 30 Minuten dauern. Wir arbeiten daran, diese Aktualisierungszeit in Zukunft zu verkürzen.
Spaced Repetition-Analysen anzeigen
Wählen Sie Schulungen in der Seitenleiste oder in Mehr aus.
Klicken Sie am oberen Rand der Seite auf Analysen und wählen Sie Spaced Repetition aus.
Auf dieser Seite können Sie Ihre Daten auf zwei unterschiedliche Weisen anzeigen:
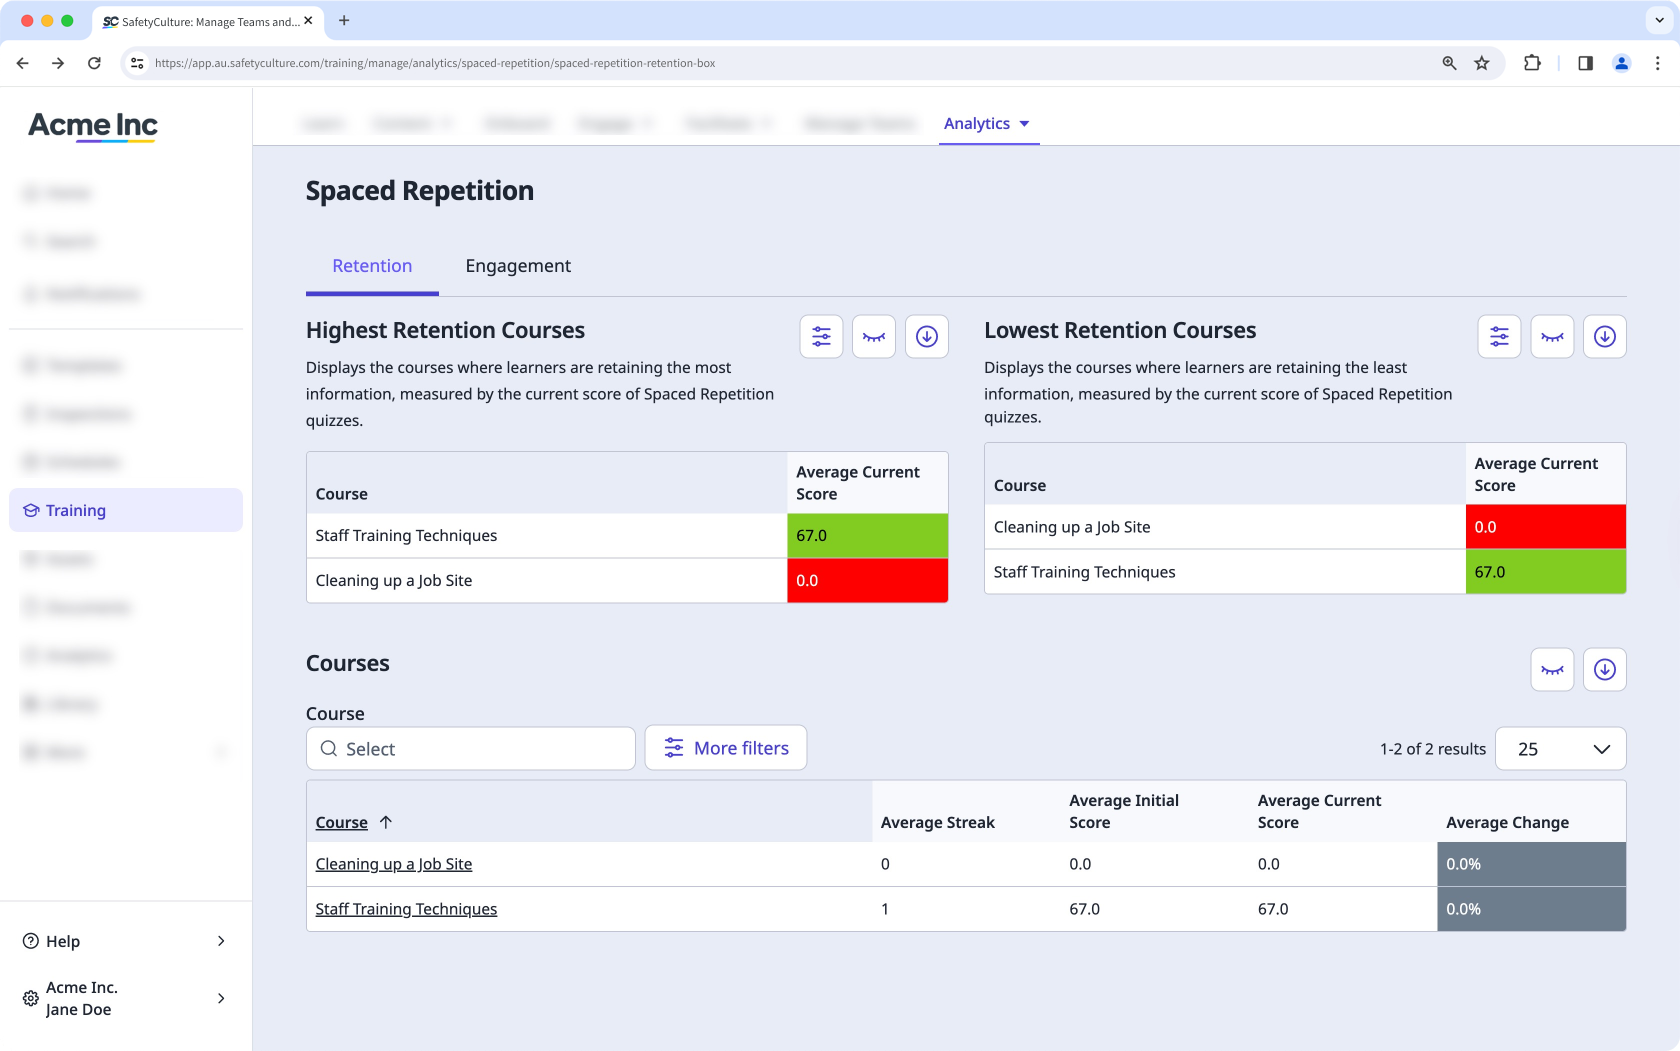
Speicherung: So erhalten Sie einen Überblick darüber, welche Kurse die höchste und die niedrigste Wissensspeicherung bei den Nutzern aufweisen, sowie über die durchschnittlichen Bewertungen und Streaks.
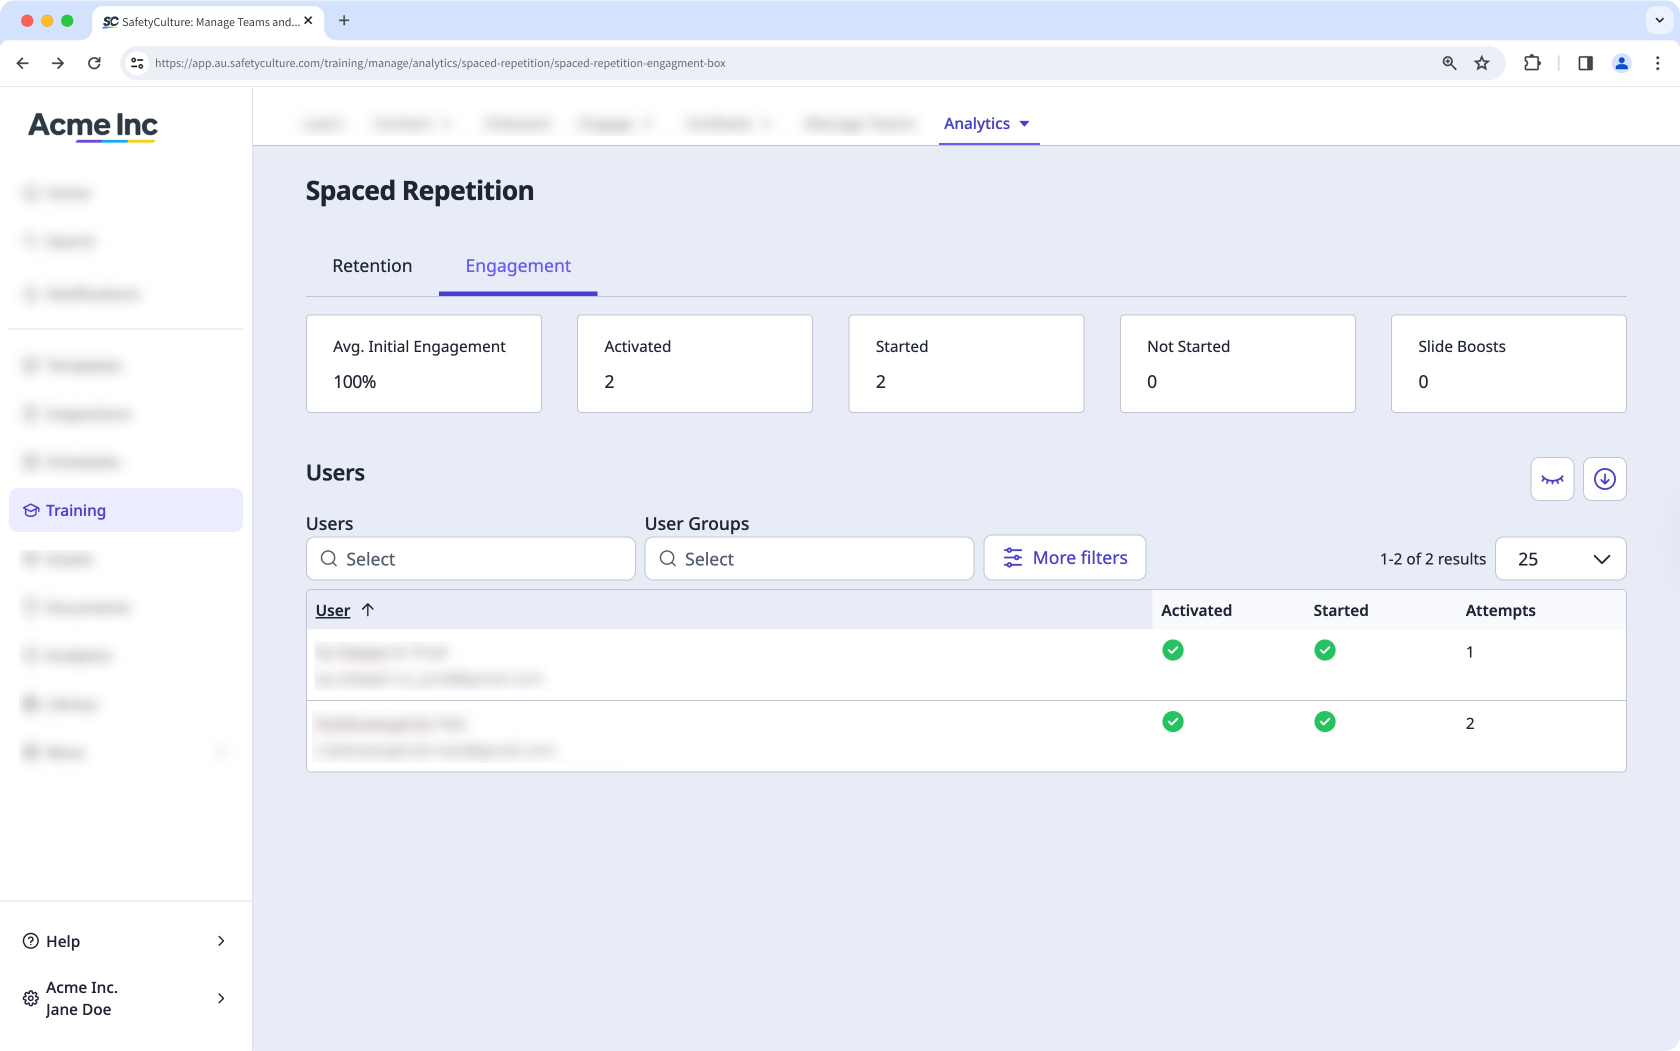
Engagement: Dies zeigt die Interaktion jedes Nutzers mit jedem Spaced Repetition Quiz.
Legen Sie mit den folgenden Optionen fest, wie Sie Ihre Schulungsdaten anzeigen möchten:
Klicken Sie auf , um Ihre Ergebnisse einzugrenzen.
Klicken Sie auf , um Spalten in Tabellen ein- und auszublenden.
Klicken Sie auf , um die Daten als CSV-Datei zu exportieren.