- SafetyCulture nutzen
- Analysen
- Anpassungsoptionen von Analysen-Diagrammen
Anpassungsoptionen von Analysen-Diagrammen
Werfen Sie einen Blick auf die verschiedenen Diagramm-Anpassungsoptionen in Analysen.Was sind Analysen-Diagramme?
Analysediagramme sind visuelle Werkzeuge, die Ihnen helfen, Ihre Daten auf einen Blick zu verstehen. Sie sind wichtig, weil sie komplexe Informationen vereinfachen und Trends hervorheben, die oft schwer zu erkennen sind.
So können Sie beispielsweise die Inspektionsergebnisse und die Fertigstellungsrate an verschiedenen Standorten während der Hochsaison vergleichen. Mit Diagrammen in Ihren Analytics-Dashboardskönnen Sie die angezeigten Daten anpassen, indem Sie Diagrammtypenändern, Attributekonfigurieren und Filtermodifizieren. So können Sie die Leistung überwachen, Muster erkennen und schneller auf Erkenntnisse reagieren.
Wir arbeiten ständig daran, die Anpassungsoptionen für Diagramme für Sie zu erweitern und zu verbessern. Wenn Sie Feedback oder Vorschläge haben, würden wir uns freuen, von Ihnen zu hören!
Anpassungsoptionen von Diagrammen
Mit dieser Option können Sie Metriken und Attribute auf der Grundlage Ihrer Diagrammkonfiguration und der Art der Daten auswählen, über die Sie berichten möchten, sei es für Inspektionen, Aktionen oder Probleme.
Mit dieser Option können SieDiagramm-Titel hinzufügen, damit Sie leicht die Daten identifizieren können, die Ihre Diagramme repräsentieren.

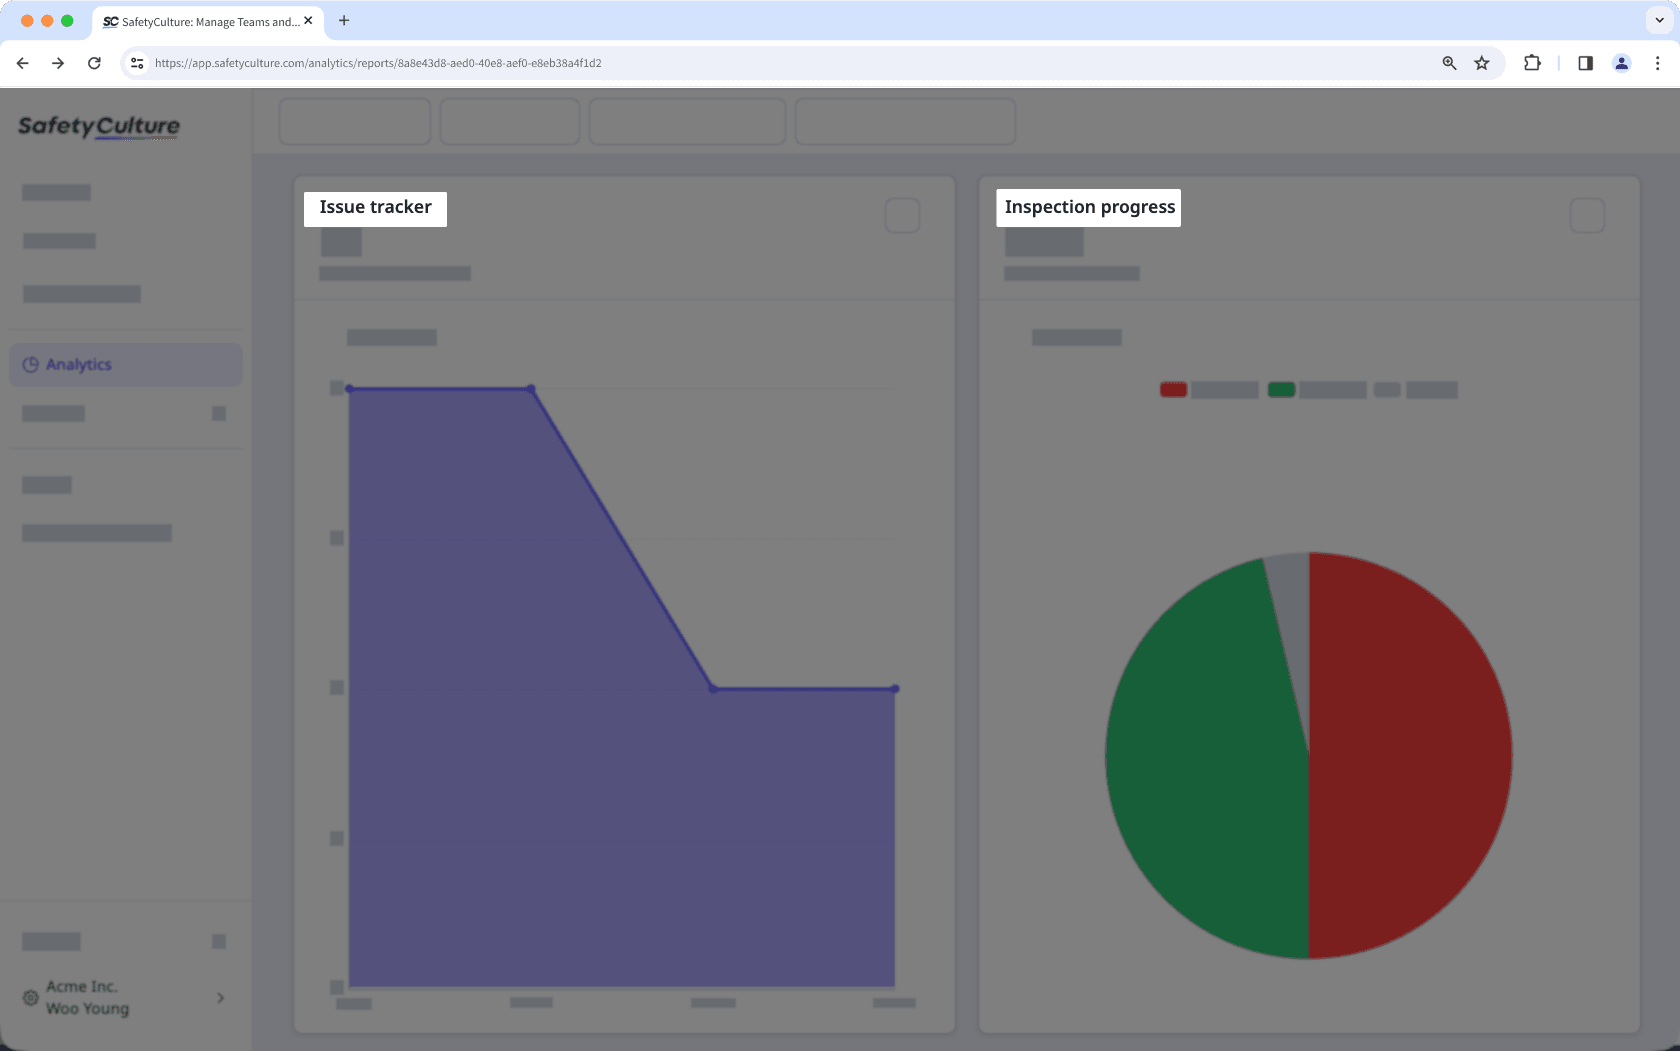
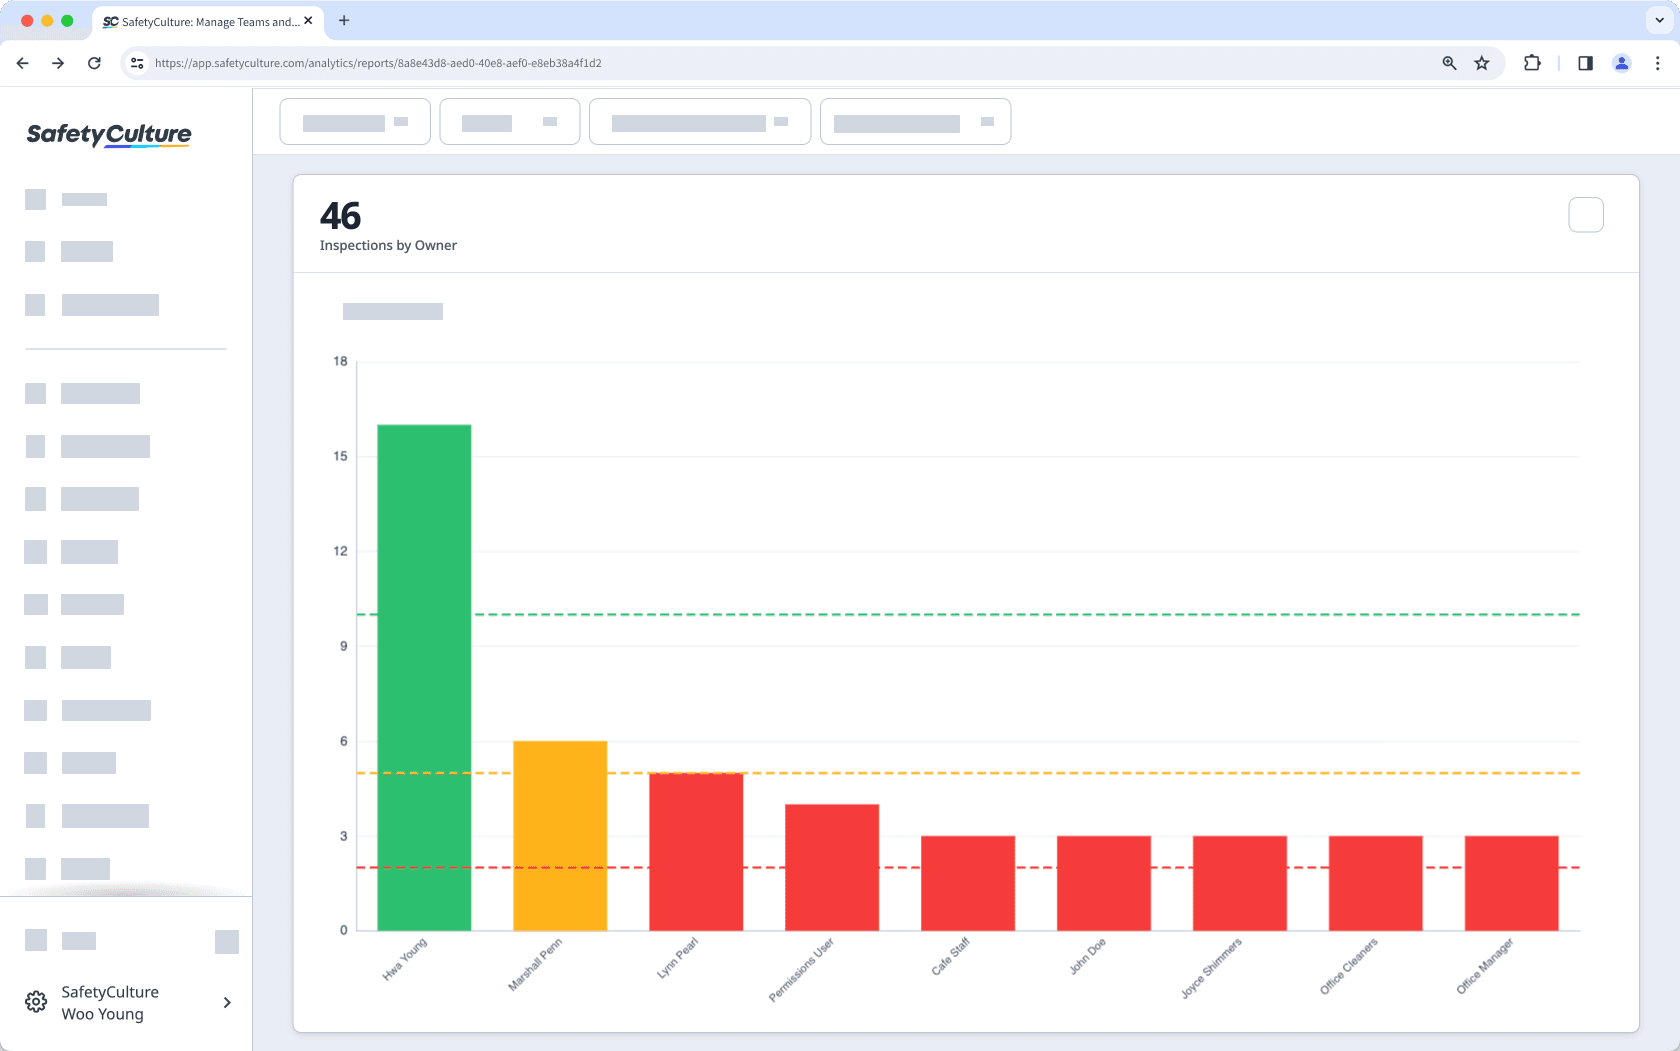
Diese Option ermöglicht es Ihnen, einen Diagrammtyp auszuwählen, der Ihre Daten visuell darstellt. Je nach Bedarf können Sie zwischen einem Balken-, Kreis-, Linien-, Tabellen-, Zifferblatt- oder Dual-Achsen-Diagramm wählen.
Mit dieser Option können Sie einen Key Performance Indicator (KPI) und einen Zielwert hinzufügen, um zu zeigen, ob Ihre Organisation ein bestimmtes Ziel erreicht hat.

Mit dieser Option können Sie steuern, welche Daten in Ihren Diagrammen angezeigt oder ausgeblendet werden. So reduzieren Sie unnötige Informationen und stellen sicher, dass nur relevante Details sichtbar sind.
Mit dieser Option können Sie die Größe Ihrer Diagramme anpassen, sodass sie auf Ihrem Dashboard kleiner oder größer dargestellt werden. So können Sie die für Ihre Organisation wichtigsten Daten besser erkennen und hervorheben.
Zur Zeit wird die Auswahl von Messwerten unter verschiedenen Datentypen für zweiachsige Diagramme nicht unterstützt. Zum Beispiel können in einem Zwei-Achsen-Diagramm nur Metriken aus dem Inspektionsdatensatz verwendet werden.
Häufig gestellte Fragen
Nein, es ist derzeit nicht möglich, verschiedene Farben für Ihre Diagramme auszuwählen und anzupassen.
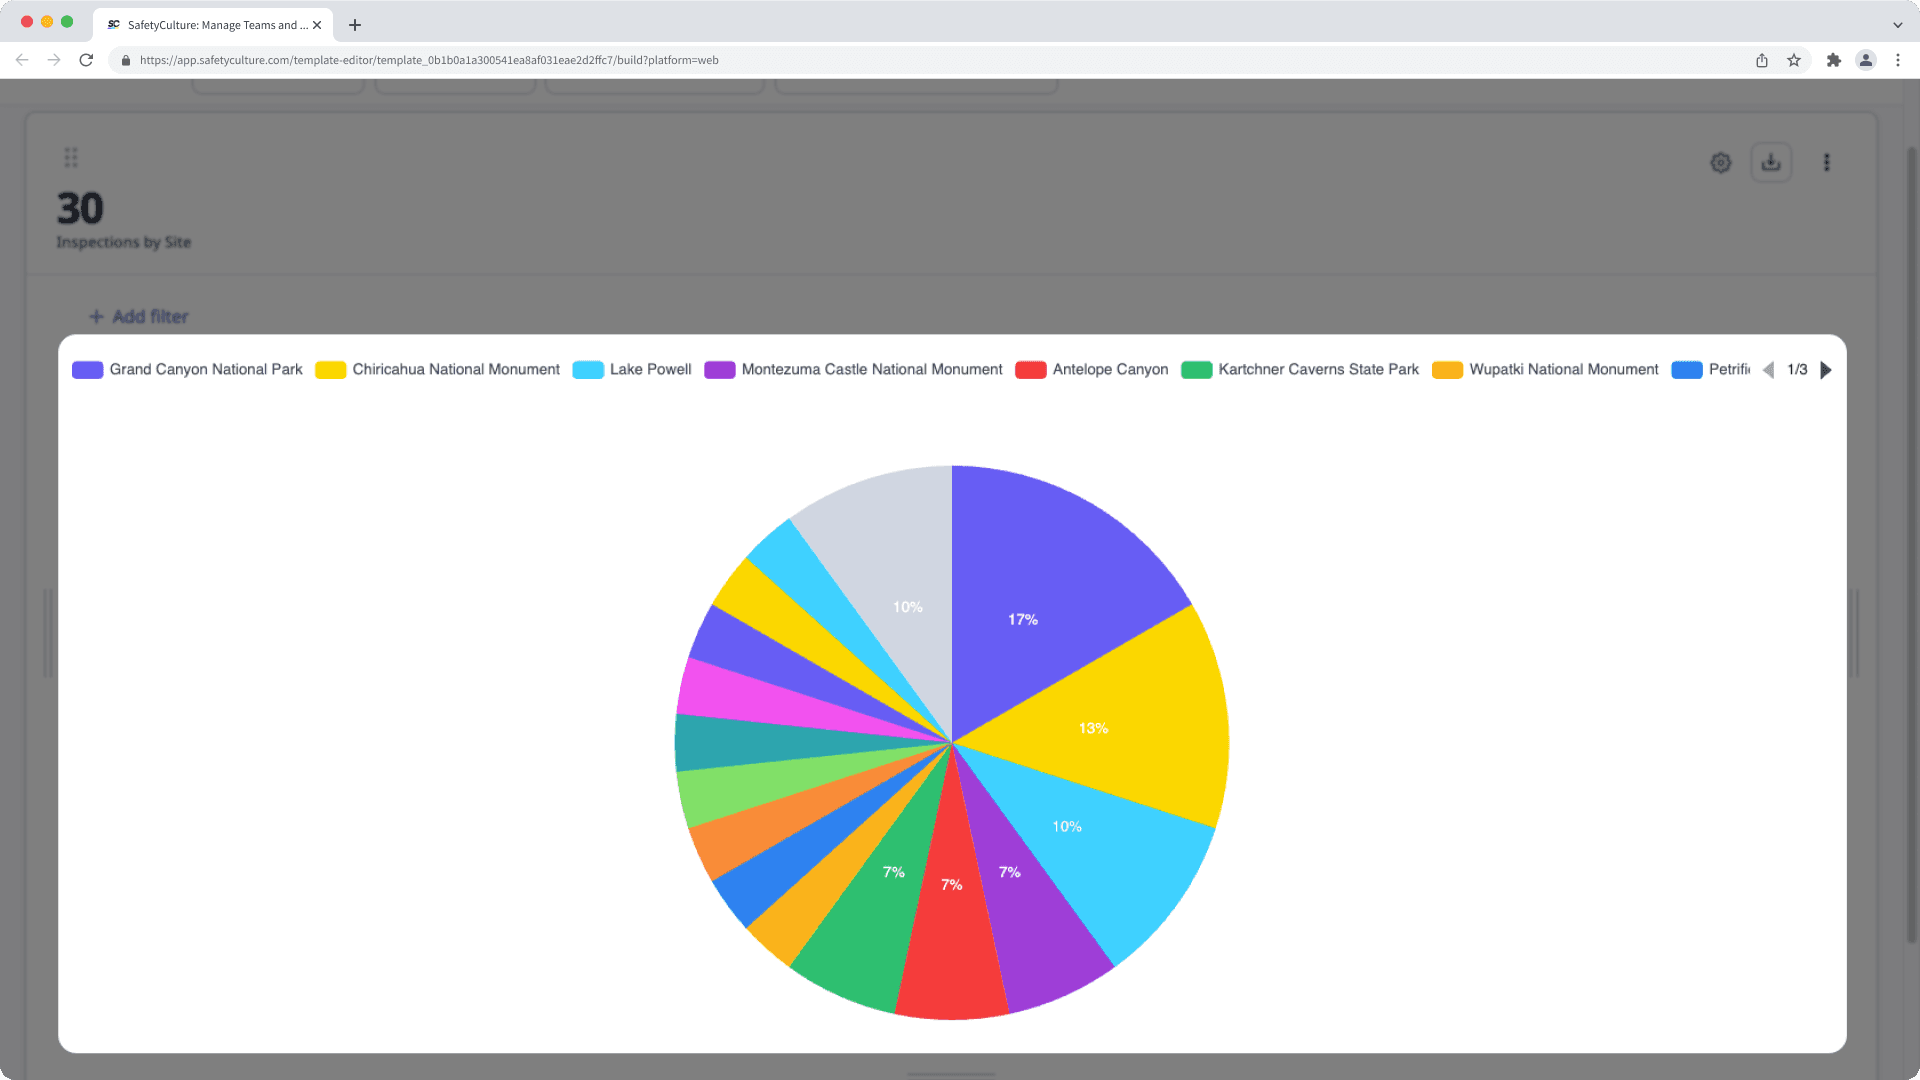
Diagramme verwenden 12 Standardfarben, die in der Reihenfolge von dem Messwert mit den meisten Daten bis zum Messwert mit den wenigsten Daten angewendet werden. Die Farbreihenfolge ist: SafetyCulture-Lila, Gelb, Hellblau, Lila, Rot, Grün, Hellorange, Blau, Orange, Hellgrün, Türkis und Pink. Nur die ersten 15 Datenpunkte werden einzeln angezeigt. Alle übrigen Daten werden gruppiert und in Grau dargestellt.

War diese Seite hilfreich?
Vielen Dank für Ihre Anmerkungen.