What are asset readings?
Asset readings are critical measurements that capture the current condition and usage of your vehicles, machinery, and equipment. These readings include data points such as odometer distances, runtime hours, location, and service dates. Together provide a factual snapshot of an asset’s health and performance. Accurate and timely asset readings enable organizations to plan maintenance proactively, avoid unexpected breakdowns, and optimize asset utilization. Whether you use inspections, connected GPS tracking devices, or telematics integrations, you have the flexibility to choose the best way to track asset usage in SafetyCulture.
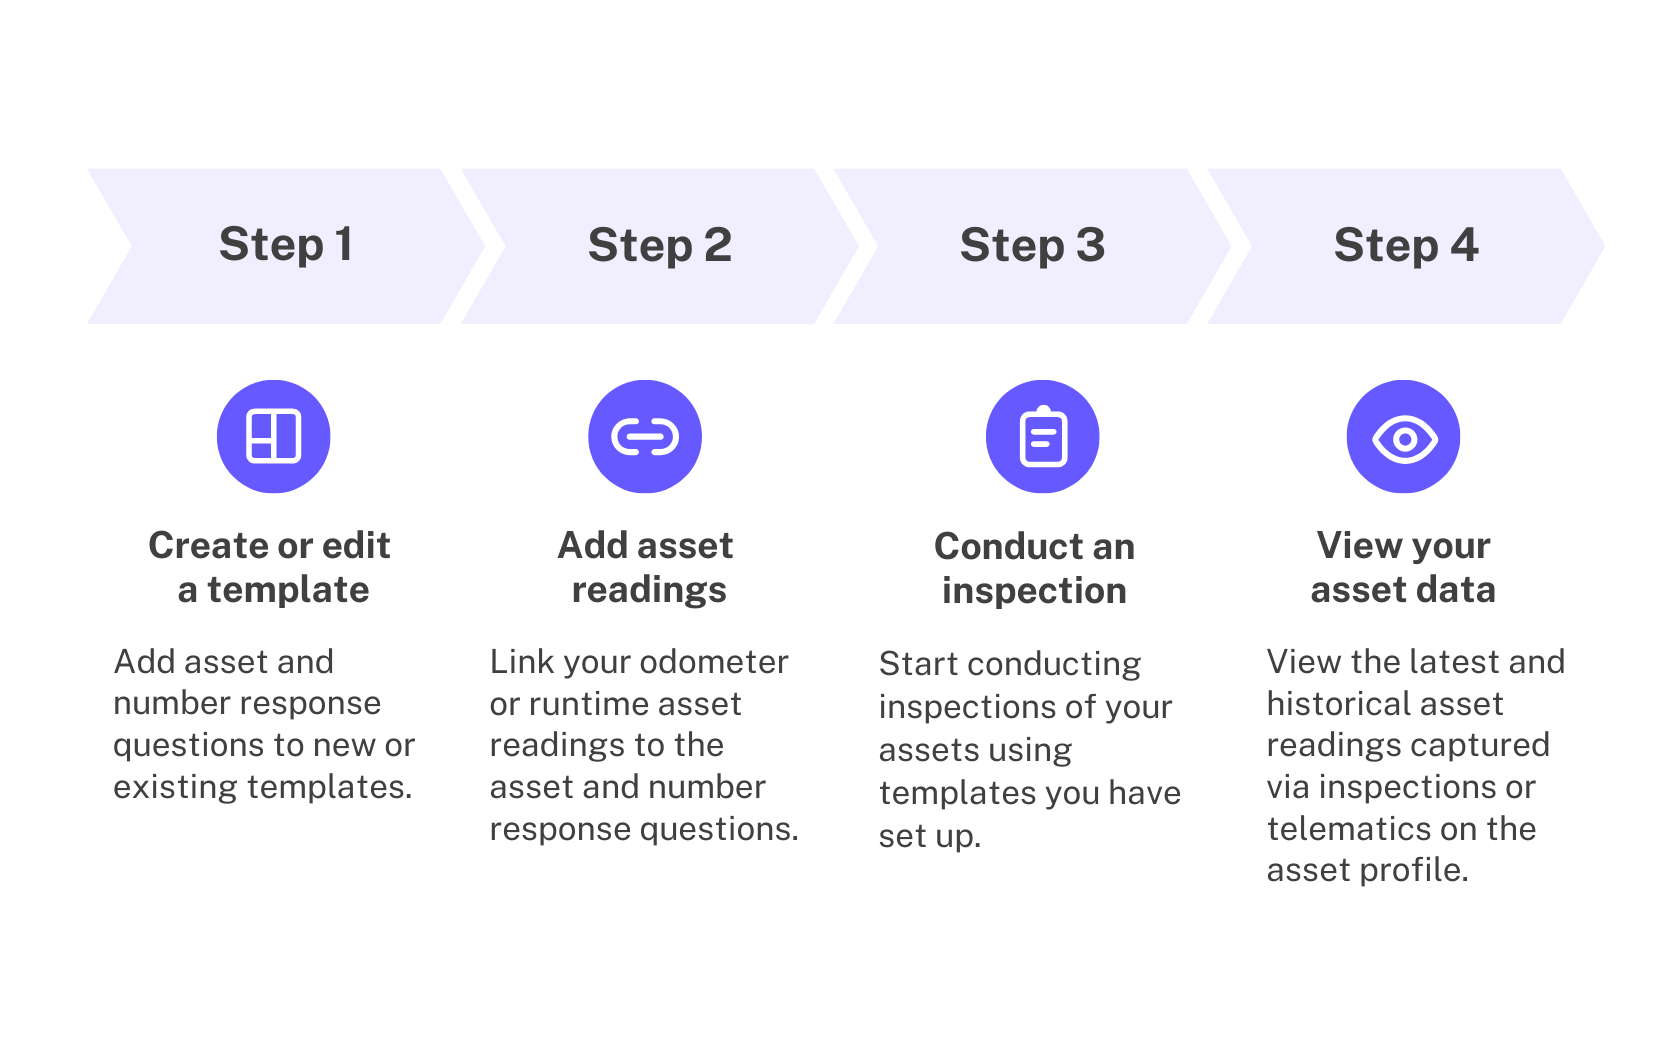
How it works
This diagram illustrates the complete process for setting up and managing asset readings for you to fully maximize the feature in the platform.
To view asset readings and usage data from an asset profile, users need both "Assets: Access" permission and "Sensors: Access" permission even when readings are captured through inspections rather than connected devices.
What you'll need
Although it's possible to create templates on the mobile app, we recommend building templates via the web app for the best experience.
Published changes made to templates only apply to new inspections moving forward.
Manage asset readings in a template
Select Templates in the sidebar or select it in More.
Click the template and select Edit template in the side panel.
In the “Title Page”, add an asset question.
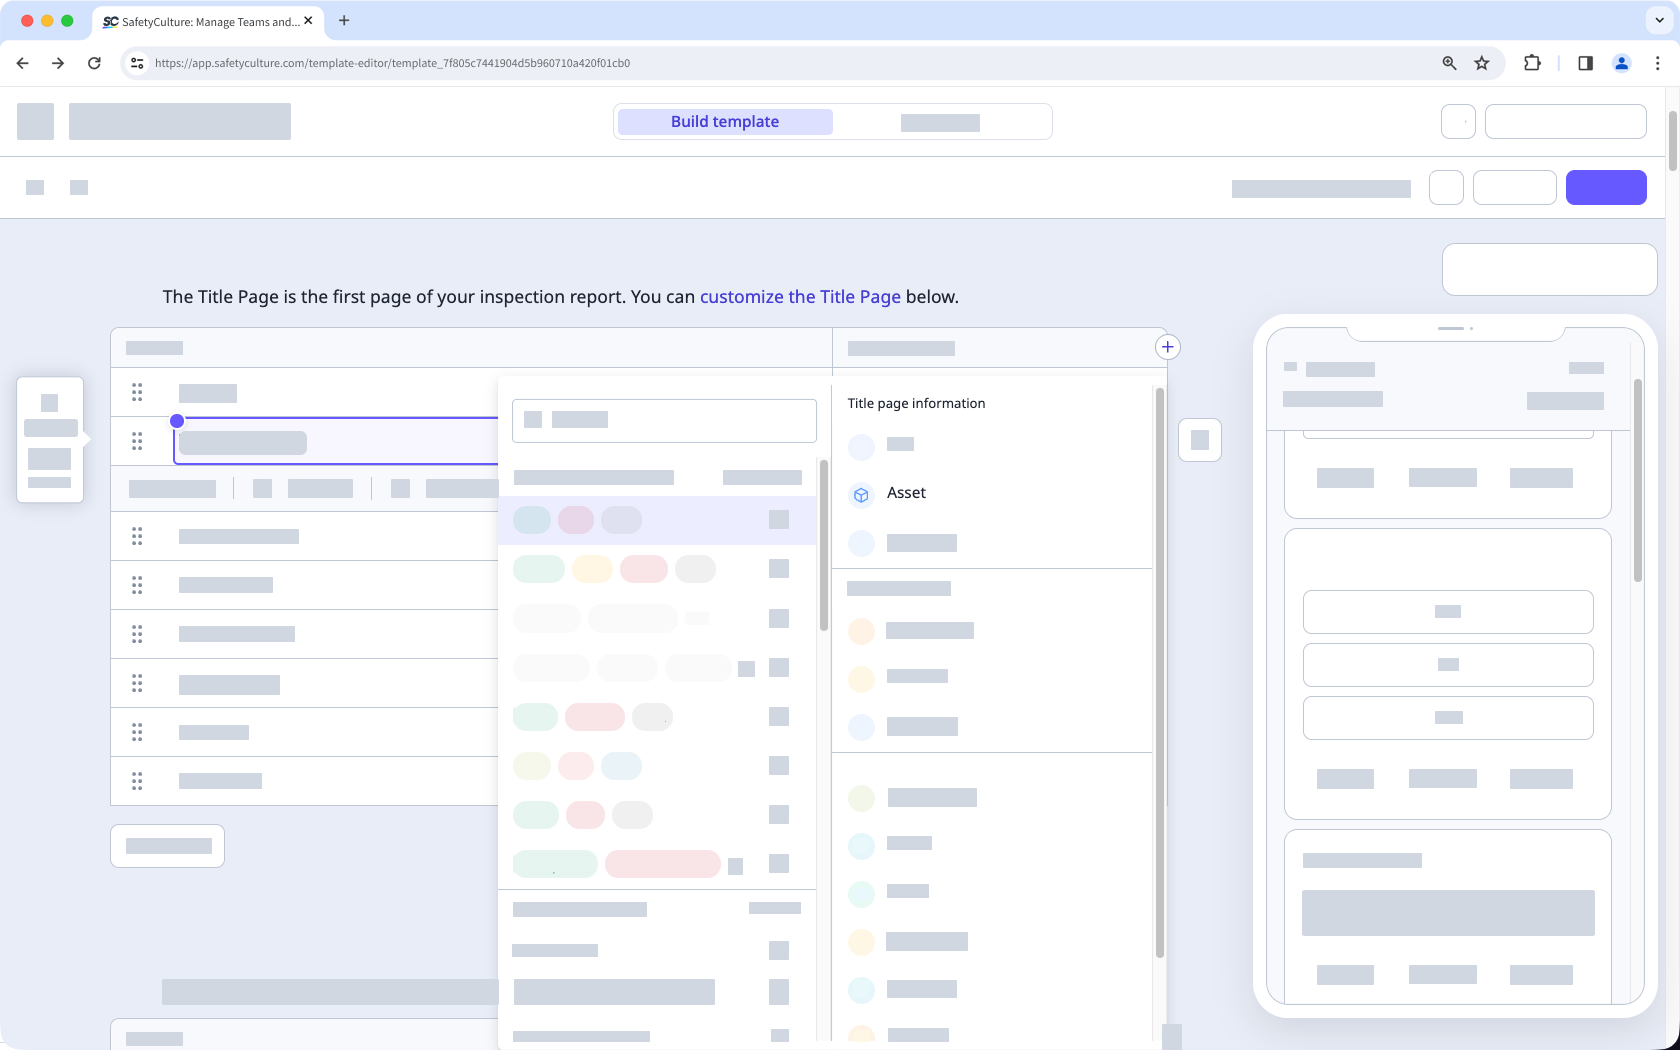
Add a new question or select an existing one.
Click under the "Type of response" column on the right-hand side and select Asset.
Add more questions or edit existing ones as needed.
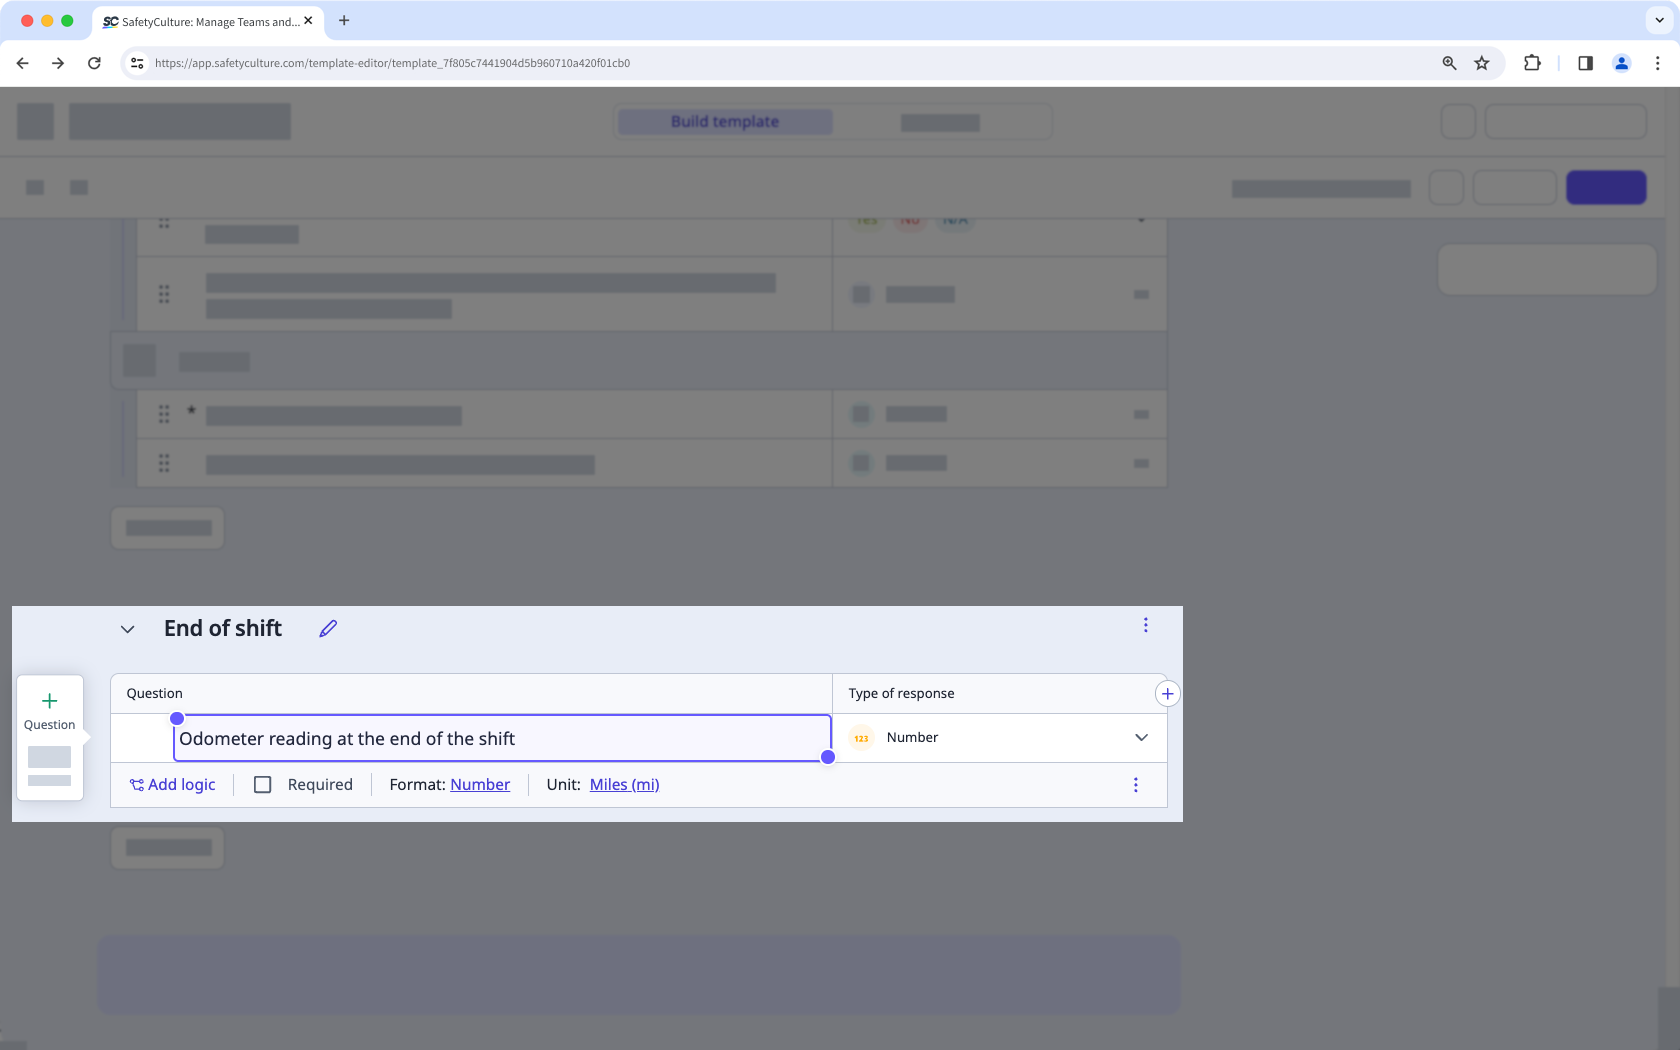
Capture asset readings by linking your asset to number response questions.
Click the asset question, and then click Add next to the "Capture readings" option.
In the side panel, select an odometer or runtime reading with the appropriate unit.
Select the relevant number response question to link it to the reading.
Click Link another reading to add more readings to the template.
Click Save and apply.
Click Publish on the upper-right of your screen to publish the template. If you're not ready to publish the template, you can go back to the templates list and come back when you're ready.
Overseeing multiple asset templates? Quickly manage all templates with asset questions, including asset types and readings from the Assets settings page.
Examples
If you remove a linked reading from a template, you won't be able to track asset usage for that reading in future inspections with the same template anymore.