¿Cómo funciona Brain Boost?
Brain Boost es una función de la Formación de SafetyCulture que ayuda a su equipo a retener conocimientos importantes mediante cuestionarios breves y personalizados. Estos cuestionarios se envían automáticamente 24 horas después de que un miembro del equipo responda a una pregunta de un curso que haya seleccionado para Brain Boost. El objetivo es reforzar la memoria revisando la información justo antes de que sea probable olvidarla.
El momento en que se envía cada cuestionario se determina mediante el algoritmo SM-2. Si un miembro del equipo responde incorrectamente a una pregunta, esta aparecerá con mayor frecuencia. A medida que siga respondiendo correctamente, la pregunta se mostrará con menor frecuencia, lo que favorece la retención a largo plazo. La tabla muestra cómo aumenta el intervalo entre repeticiones con cada respuesta correcta:
Número de veces que una pregunta se responde correctamente de forma consecutiva | Cuándo volverá a aparecer la pregunta |
|---|---|
0 veces | Al día siguiente |
1 vez | 3 días después del último cuestionario |
2 veces | 10 días después del último cuestionario |
3 veces | 30 días después del último cuestionario |
4 veces | 60 días después del último cuestionario |
5 veces | Ya no aparecerá |
También puede ver las estadísticas de Brain Boost de su equipo para ver cómo están reteniendo la información y participando en los cuestionarios a lo largo del tiempo.
Lo que necesitarás
Los datos de repaso espaciado pueden tardar hasta 30 minutos en sincronizarse y actualizarse. Estamos trabajando para reducir este tiempo de actualización en el futuro.
Ver estadísticas de Repaso espaciado
Seleccione Formación en la barra lateral o selecciónelo en Más.
Haga clic en Estadísticas en la parte superior de la página y seleccione Repaso espaciado.
En esta página, puede ver sus datos de dos maneras diferentes:
Retención: le ofrece un resumen de qué cursos tienen la mayor y menor retención de conocimientos entre los usuarios, así como las rachas y puntuaciones medias.
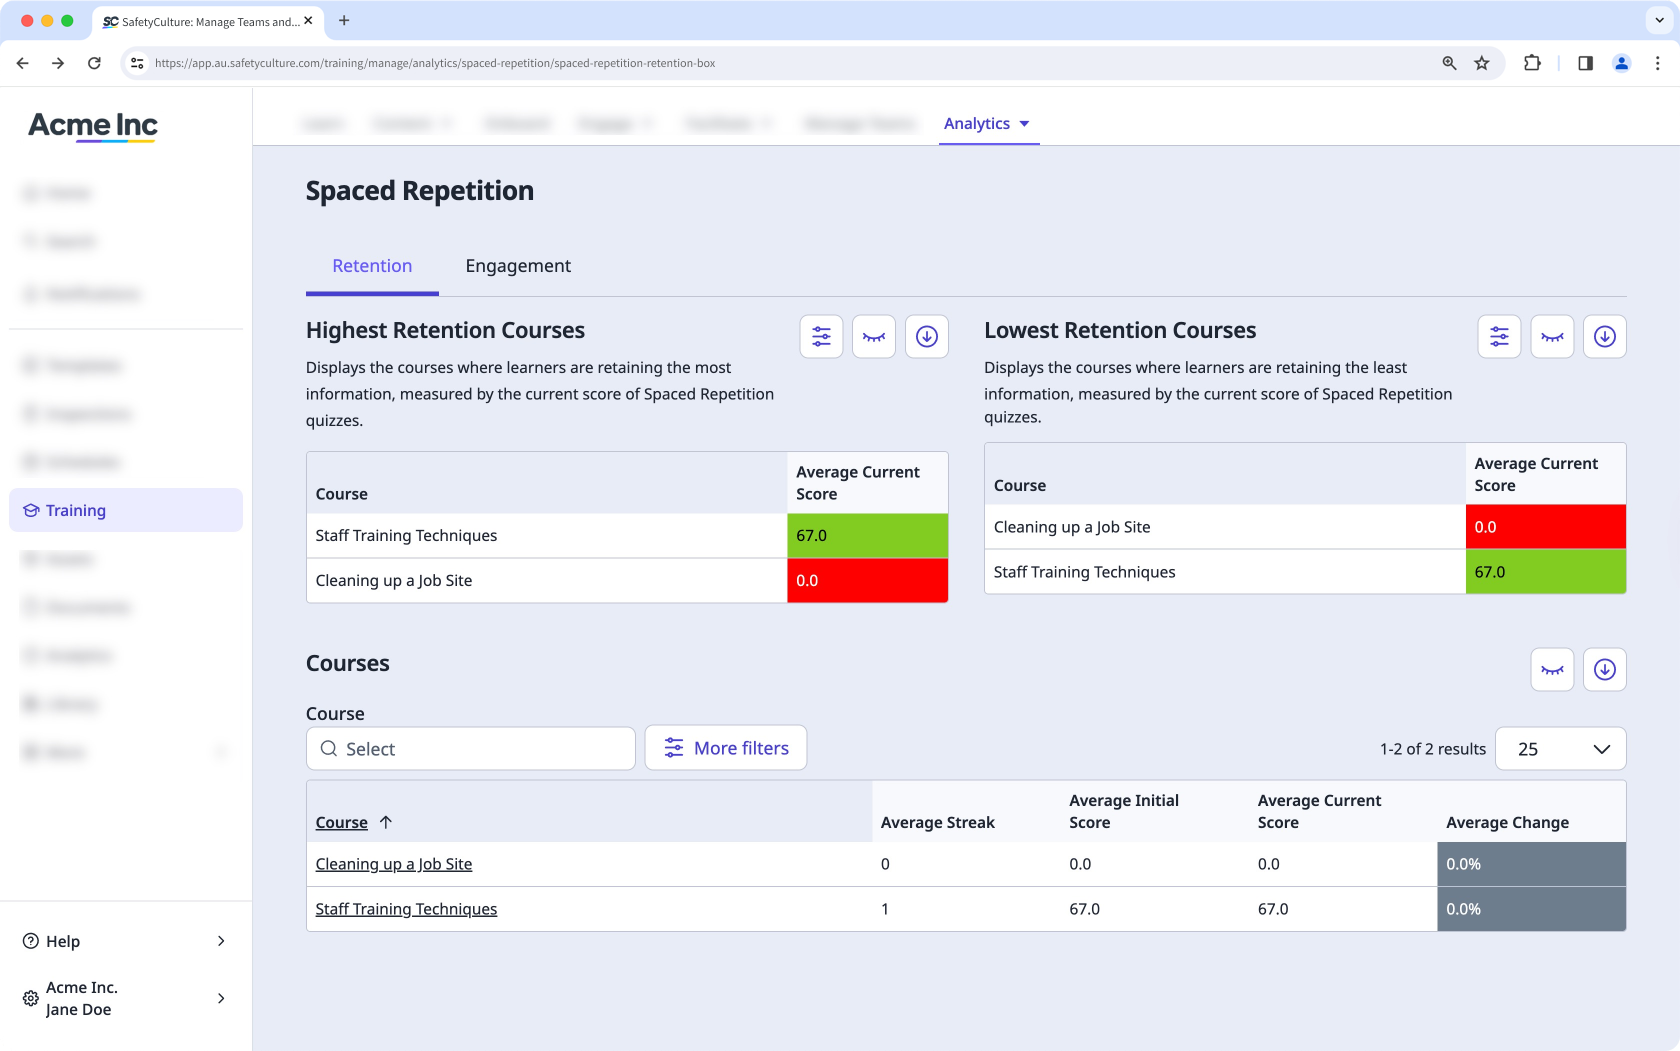
Participación: muestra la interacción de cada usuario con cada cuestionario de Repaso espaciado.
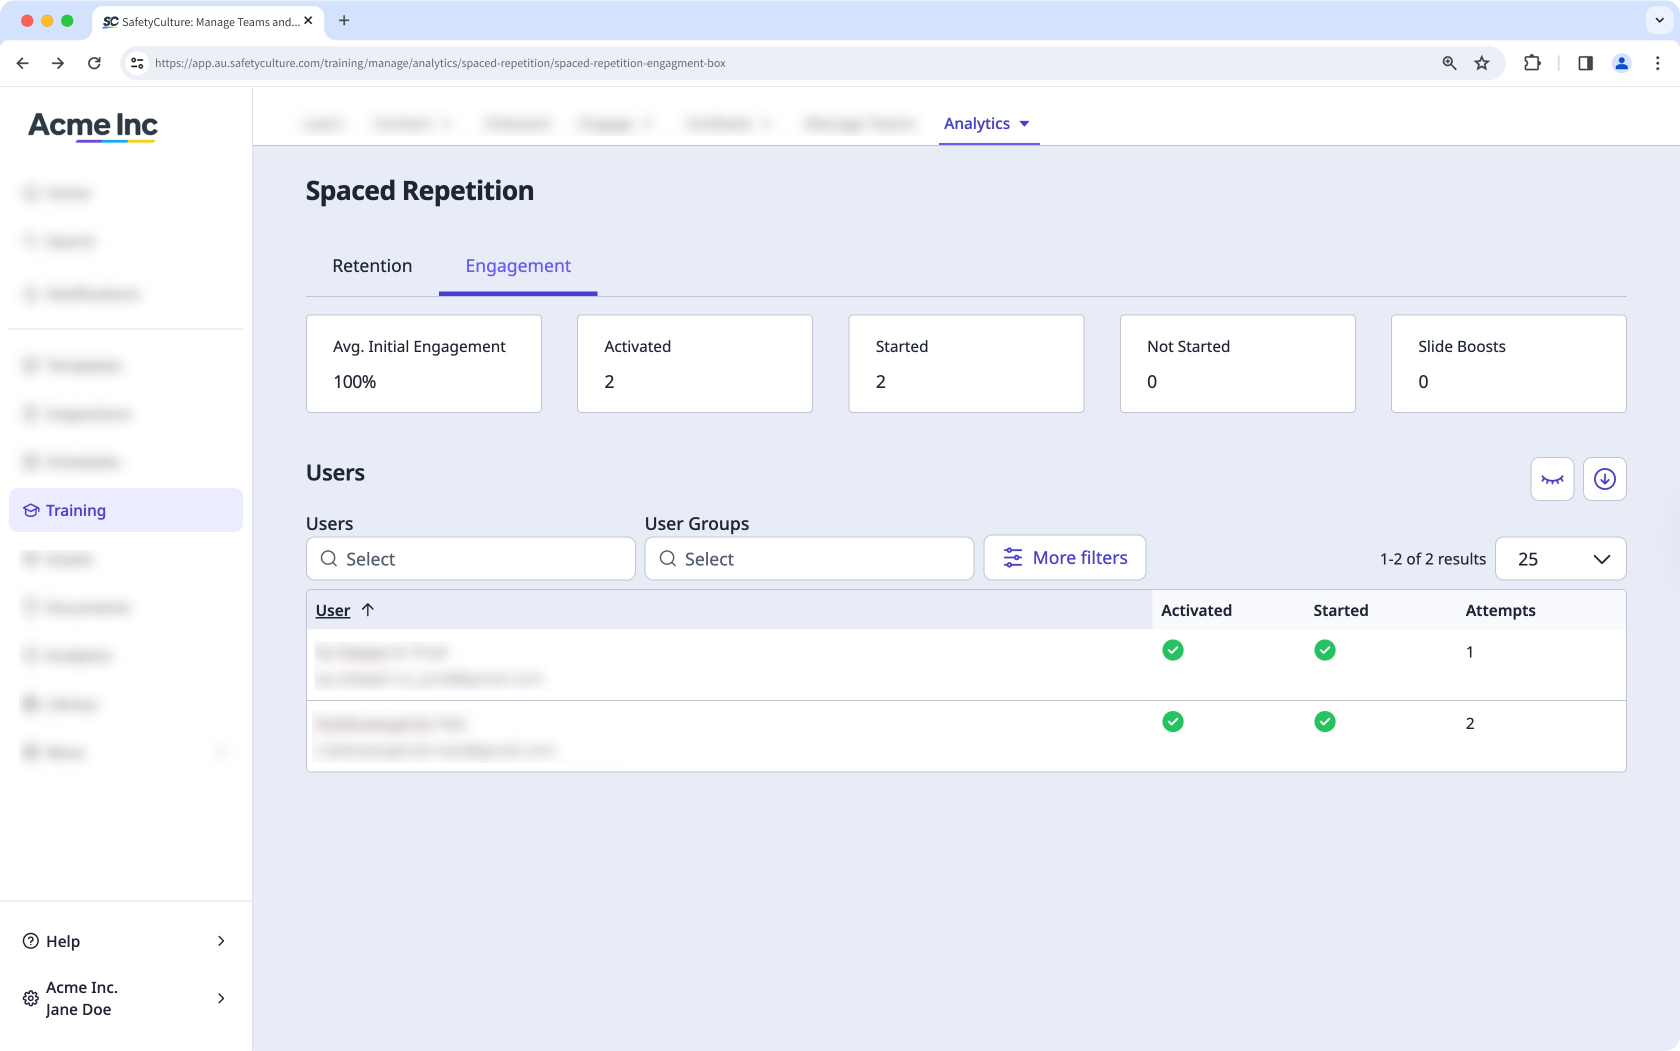
Personalice cómo quiere ver sus datos de formación utilizando las siguientes opciones:
Haga clic en para delimitar sus resultados.
Haga clic en para mostrar y ocultar las columnas en las tablas.
Haga clic en para exportar los datos como CSV.