How does Spaced Repetition work?
Spaced Repetition is a feature in SafetyCulture Training that helps your team retain important knowledge through short, personalized quizzes. These quizzes are automatically sent 24 hours after a team member answers a question from a course you’ve selected for Spaced Repetition. The goal is to strengthen memory by reviewing information just before it’s likely to be forgotten.
The timing of each quiz is based on how well a team member is retaining information. If they answer a question incorrectly, they'll see it more often. As they continue to answer correctly, the question will appear less frequently, helping them build long-term retention. The table below outlines how the interval between repetitions increases with each correct answer:
Number of times a question is answered correctly in a row | When will the question appear again |
|---|---|
0 times | The next day |
1 time | 3 days after the last quiz |
2 times | 10 days after the last quiz |
3 times | 30 days after the last quiz |
4 times | 60 days after the last quiz |
5 times | It will no longer appear |
You can also view your team’s Spaced Repetition analytics to see how well they’re retaining information and engaging with quizzes over time.
What you'll need
Spaced Repetition data can take up to 30 minutes to sync and refresh. We're working to reduce this refresh time in the future.
View Spaced Repetition analytics
Select Training in the sidebar or select it in More.
Click Analytics at the top of the page and select Spaced Repetition.
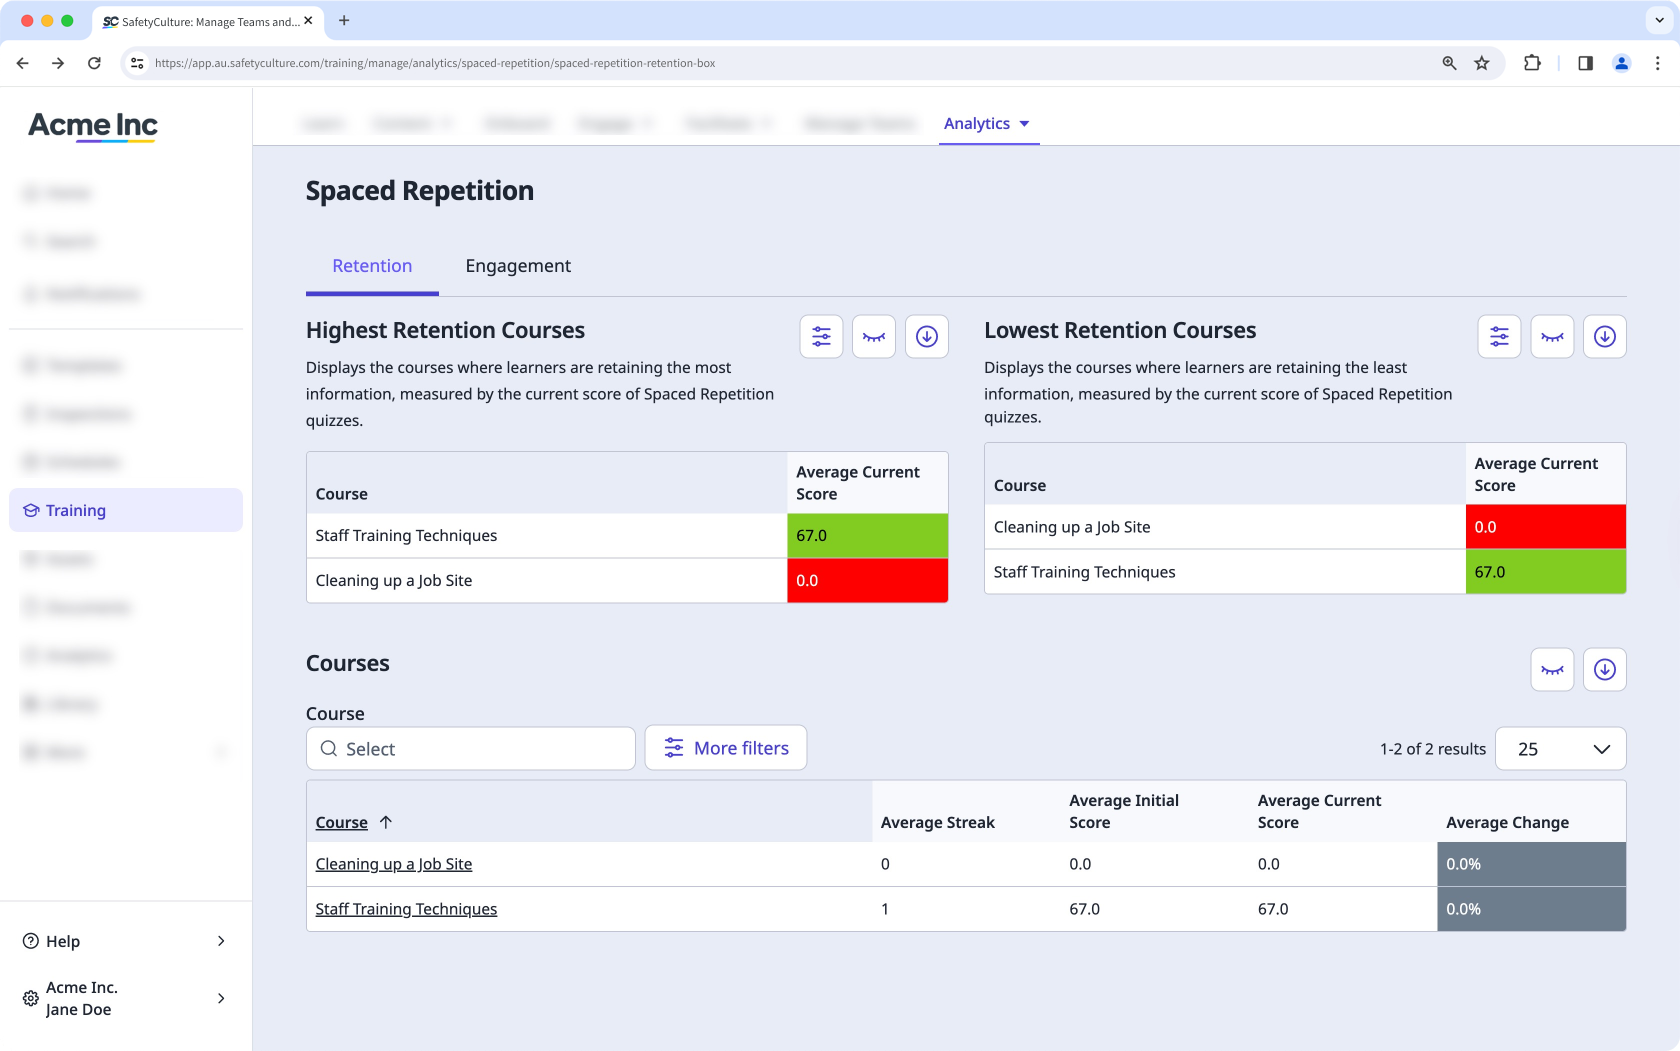
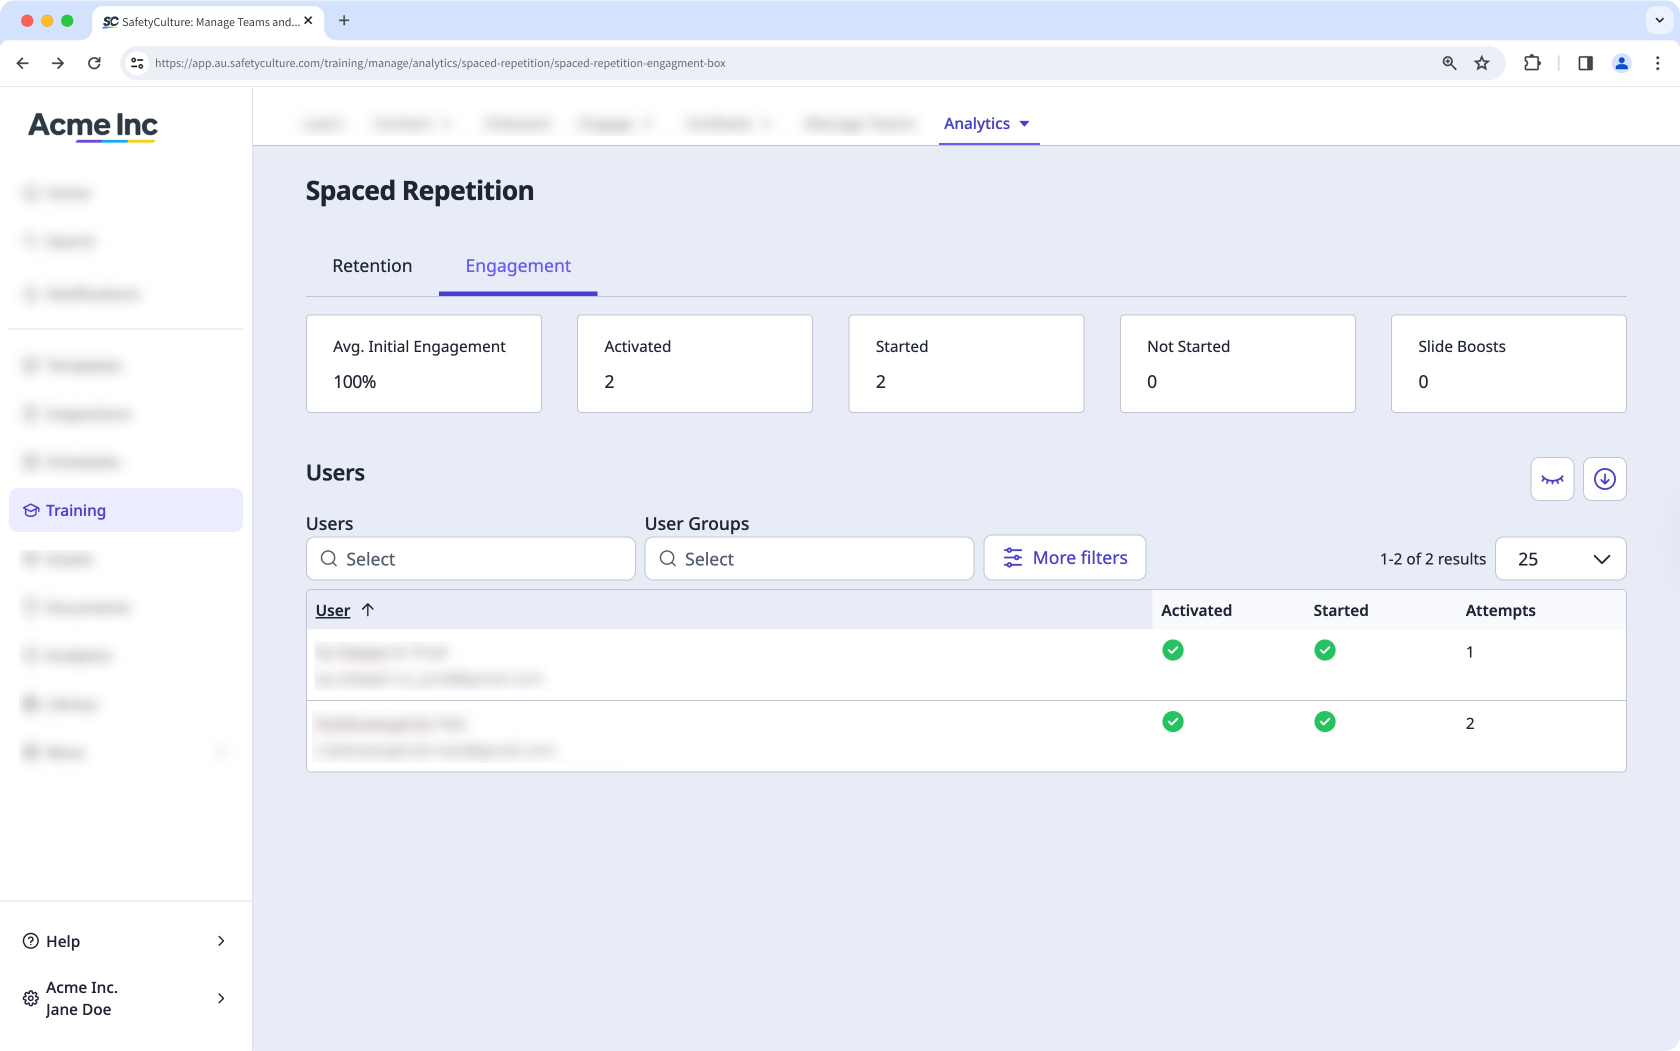
On this page, you can view your data in two different ways:
Retention: This gives you an overview of which courses have the highest and lowest knowledge retention among users, as well as the average scores and streaks.
Engagement: This shows each user's interaction with every Spaced Repetition quiz.
Customize how you want to view your training data using the following options:
Click to narrow down your results.
Click to show and hide columns in tables.
Click to export the data as CSV.