Export Analytics dashboards as PDF
Learn how to export Analytics dashboards as PDF via the web app to get a full overview of your charts in a single file.How does exporting a dashboard work?
When you export an Analytics dashboard, you get a snapshot of all your charts in one PDF file. You can export the entire dashboard at once instead of downloading individual charts while keeping it visible for reference. This makes it easier for teams to share reports across the organization without manually compiling information, reducing the risk of error.
Dashboard export configuration
Depending on the chart type, you can configure which parts of your charts are included in the PDF file. These configurations are captured only for charts that are visible on the page when you export the dashboard. Any charts you've scrolled past appear in the PDF file in their default state.
Charts with legends
You can hide segments of a chart by clicking the corresponding item in the legend. The hidden segment doesn't appear in the chart in the PDF file, but the legend remains visible.
Scrollable charts
You can scroll and adjust the zoom on your charts using the scrollbar.
Responses table
You can hide and collapse rows in the Responses table.
Export an Analytics dashboard as PDF
Select
 Analytics in the sidebar or select it in
  More.
More.Click the dashboard.
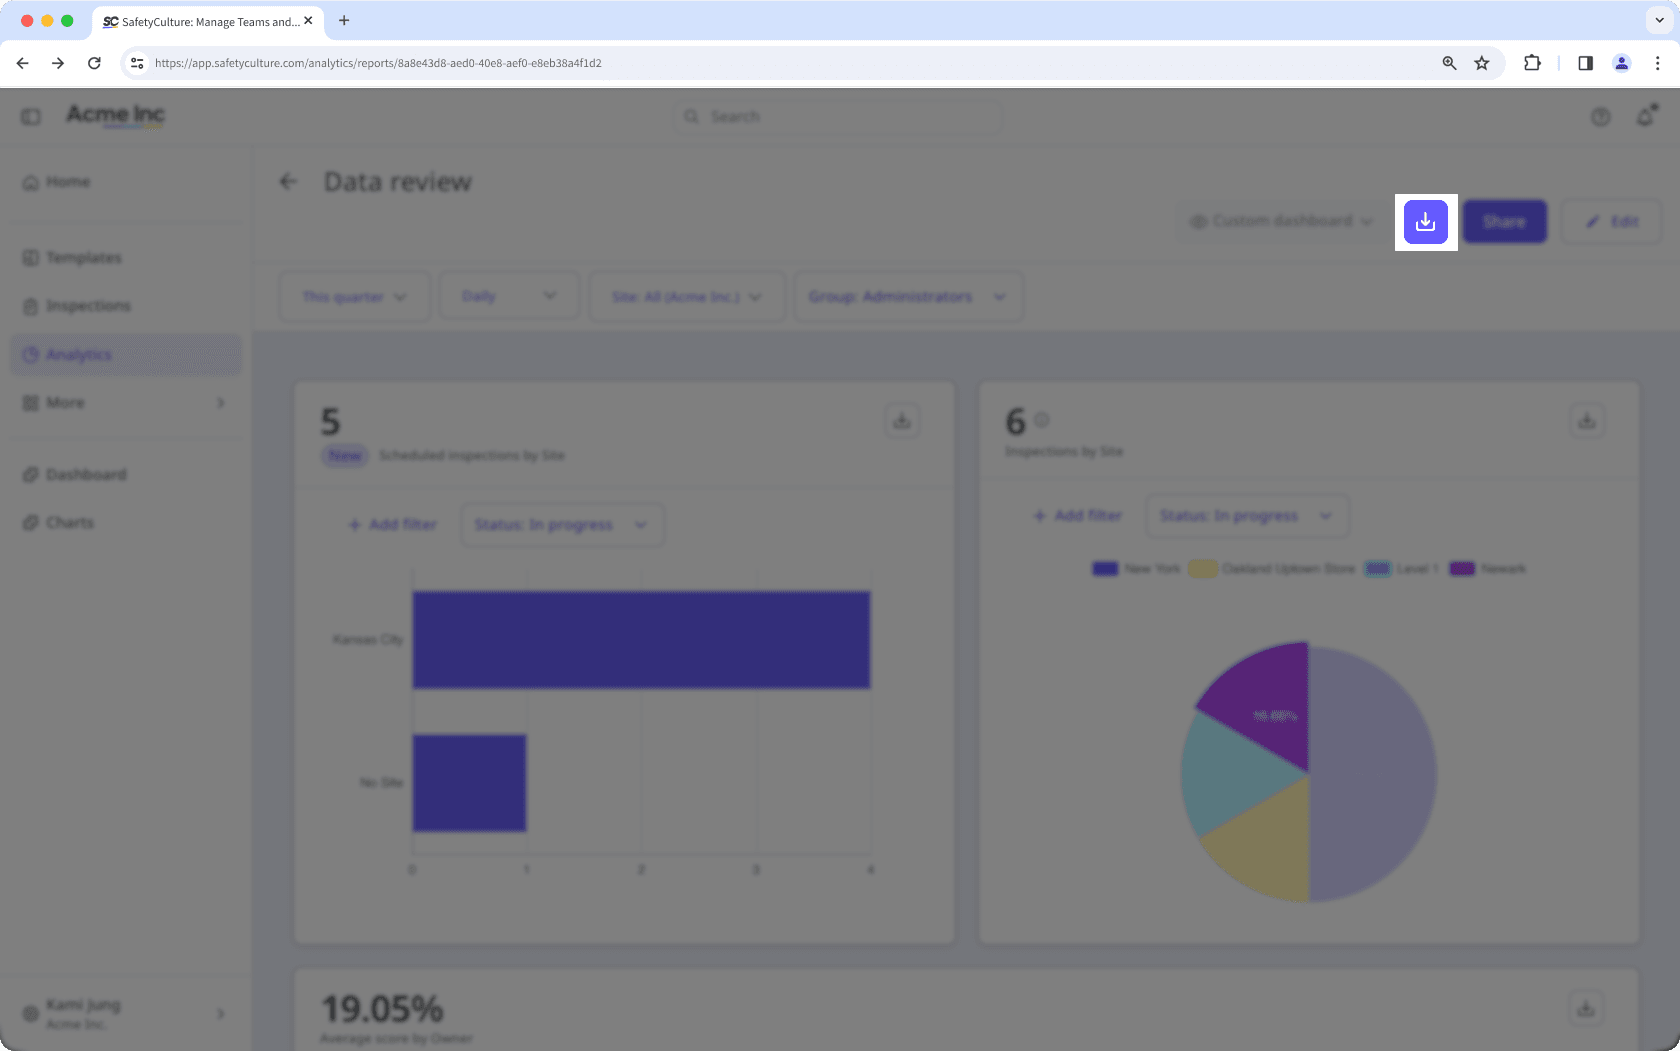
Click
 on the upper-right of the dashboard.
Hovering over a chart while the dashboard is exporting adds a shadow to the part of the chart in the exported PDF file. To prevent this, keep your cursor away from the charts until the export is complete.
Frequently asked questions
No. You can only export one dashboard at a time. If you would like us to support bulk exporting dashboards, please let us know by providing your feedback.
Was this page helpful?
Thank you for letting us know.