What asset reading data can I view?
Gain visibility over how your assets are used over time so you can plan preventative maintenance accordingly. You can view readings captured via inspections or connected telematics, then drill into daily activity and long-term trends right from the asset profile.
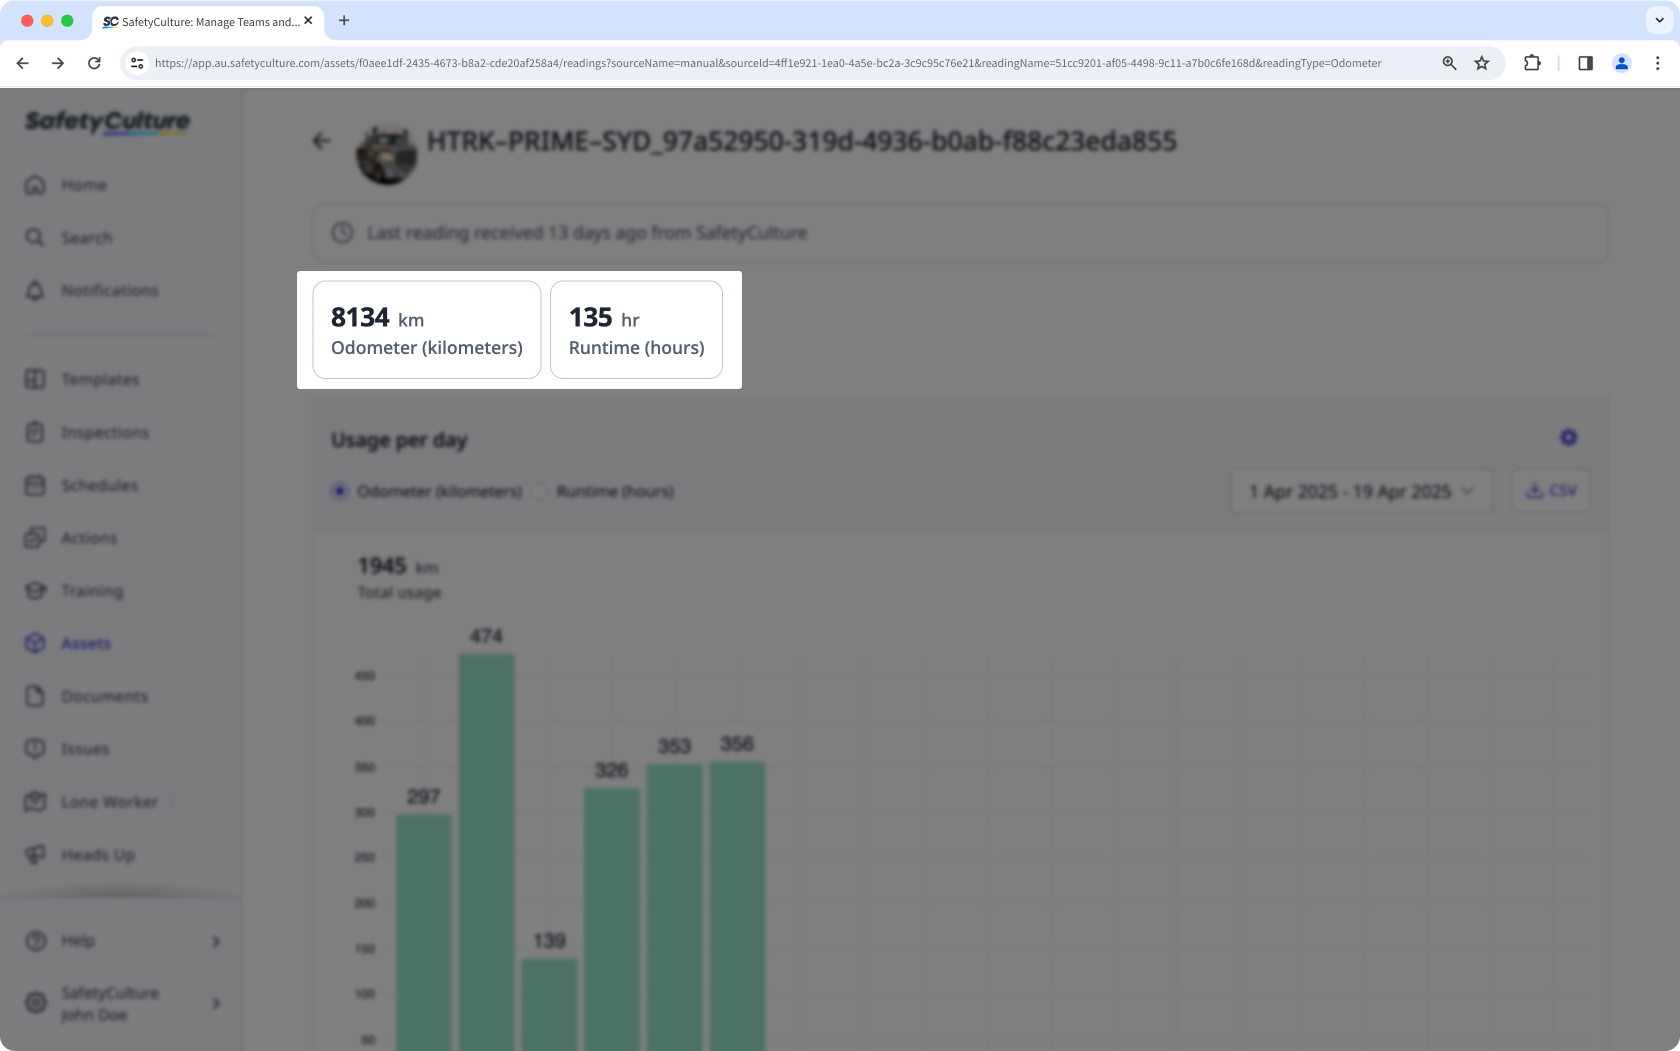
Latest readings
View the most recent odometer and runtime values recorded for the asset. Use this snapshot to confirm the current meter position before you review usage trends or investigate anomalies.
Usage per day bar chart
This chart shows a day-by-day view of an asset's odometer or runtime usage for a selected date range. Use it to spot activity trends and verify readings. 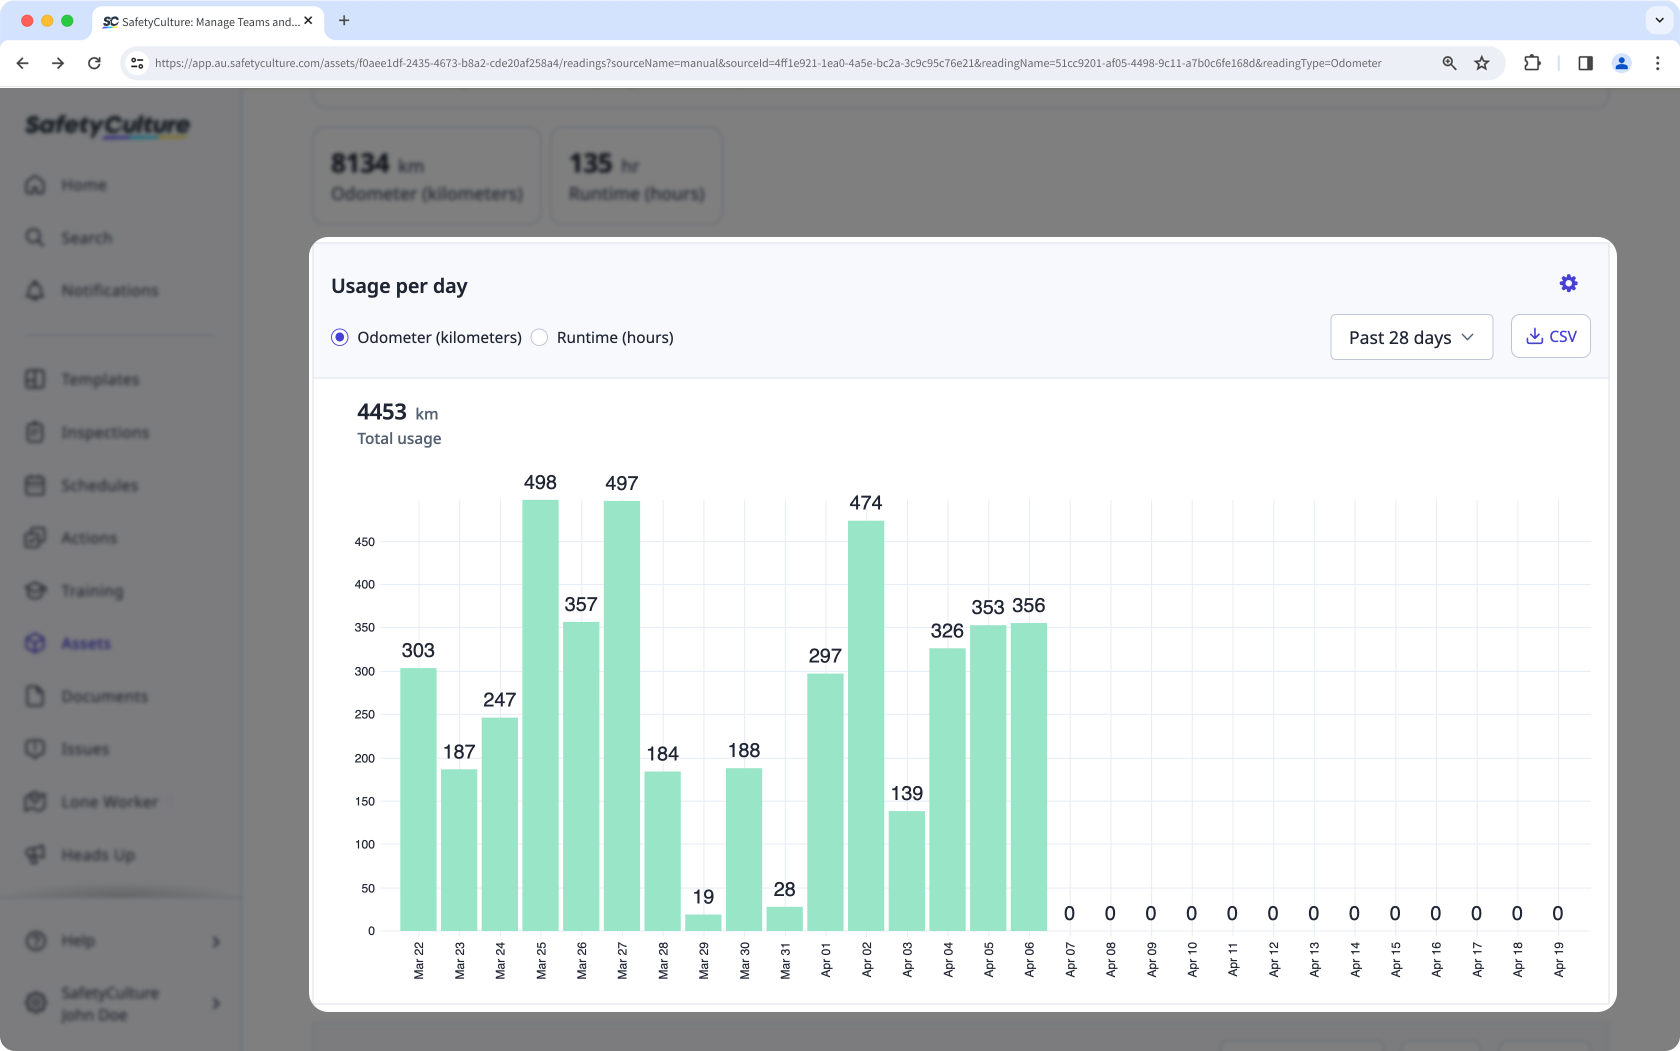
Reading type: Switch between odometer and runtime readings on the upper-left of the chart.
Date range: Click the date picker on the right-hand side and select a period.
Total usage: The value on the upper-right of the chart is the sum of all the usage values for the reading type over the selected period.
Bars: Each bar represents usage for a single day, calculated from consecutive cumulative readings. Days with no new reading appear as 0. A new reading that is lower than the previous value appears as negative.
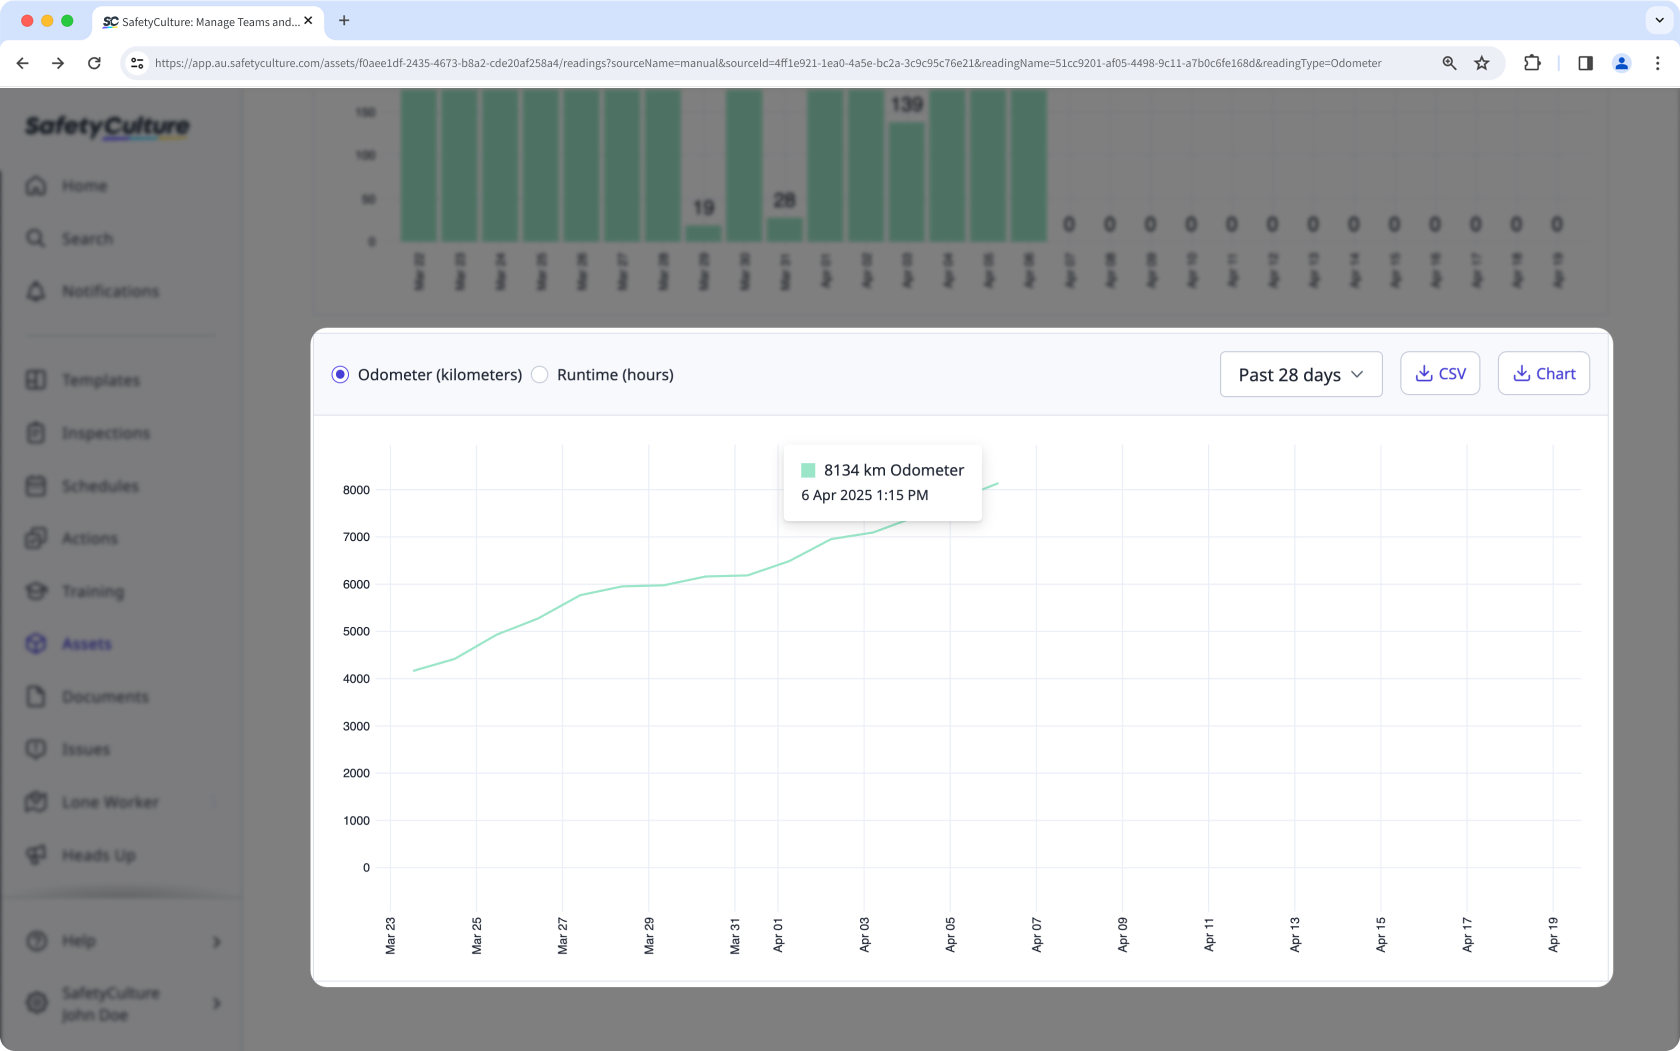
Historical readings line chart
This chart shows how an asset's cumulative odometer or runtime reading changes over the selected date range. Use it to understand the broader usage trend across weeks or months.
Reading type: Switch between odometer and runtime readings on the upper-left of the chart.
Date range: Click the date picker on the right-hand side and select a period.
Line and points: Each point is a reading captured for the asset. The line connects points to show the cumulative trend.
Flat line: No new reading was captured on those days, so the value stays the same.
Decrease in reading: A lower new reading appears as a drop, which usually indicates a meter reset/replacement or an incorrect entry.
Sharp increase: A large jump between points reflects heavy use since the last reading or a long gap between readings.
Want to compare utilization across your entire fleet? Export your asset data as a CSV file and analyze more assets at once than the charts allow.
The odometer units shown in the utilization charts and CSV are dependent on the distance metric you have set.
What you'll need
Capturing readings via telematics is available to organizations on the Premium Plan or Enterprise Plan. Get in touch with a product expert to learn more about our sensor and telematics solutions.
View asset readings
Select Assets in the sidebar or select it in More.
Select an asset.
In the asset profile, view the latest readings.
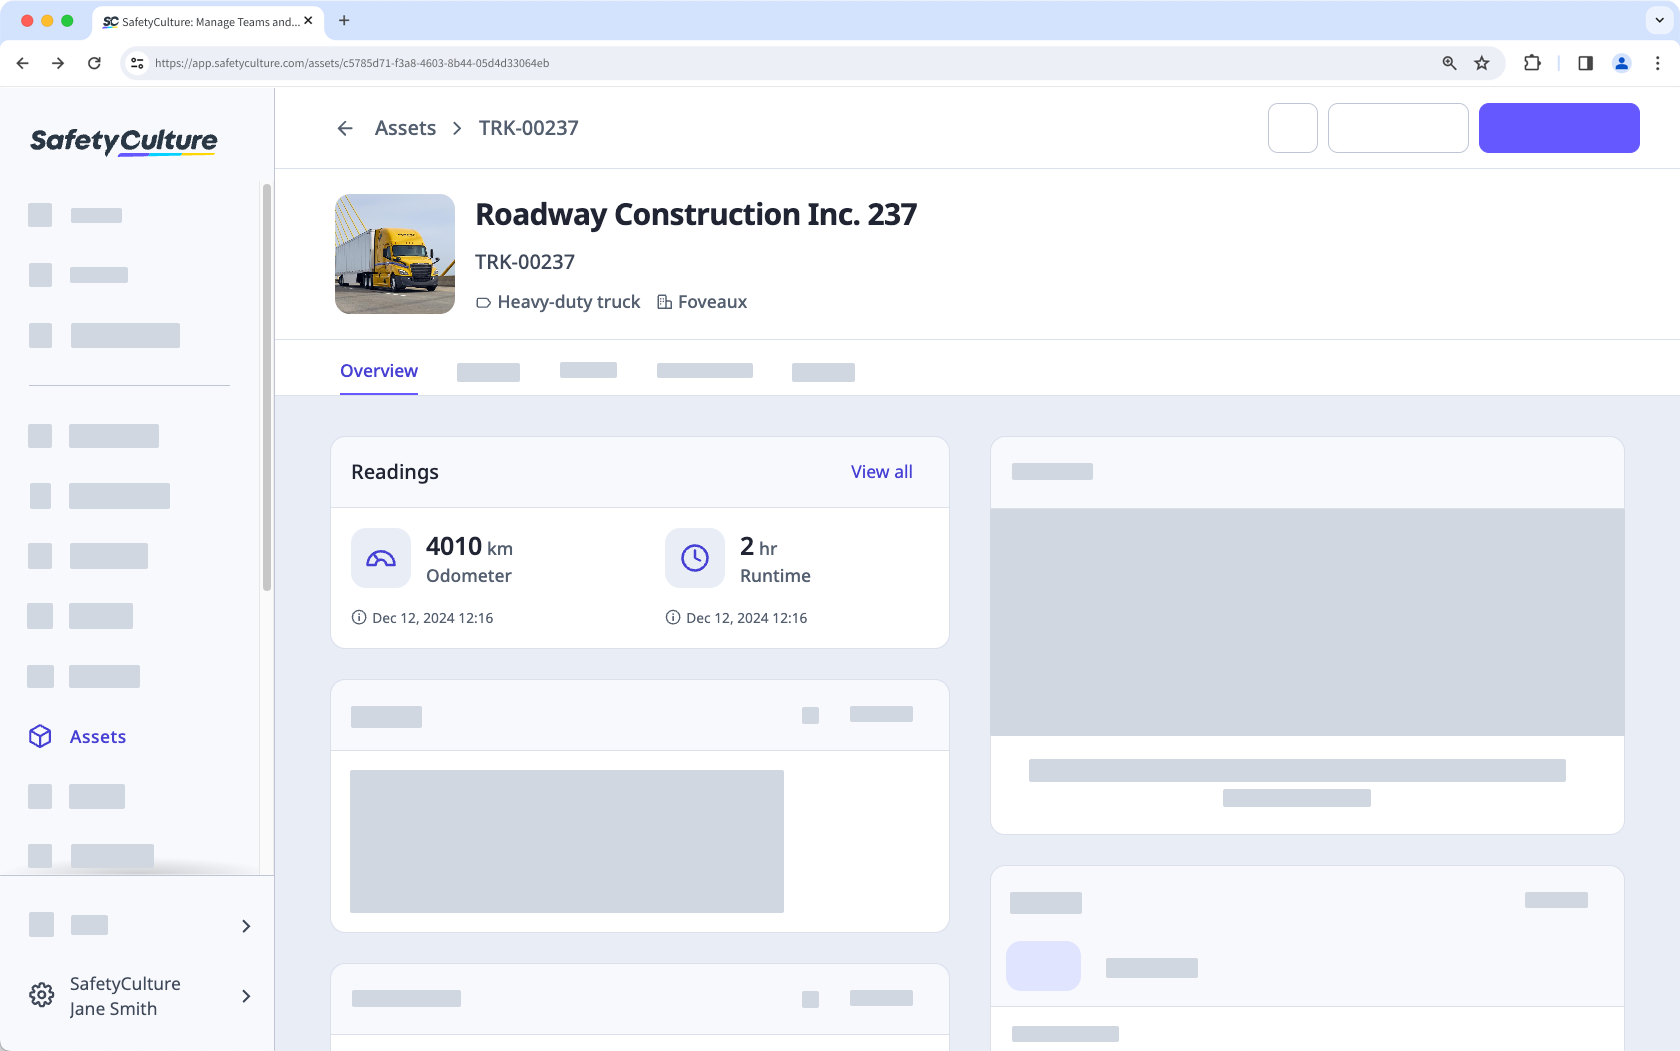
Click a reading to view the asset reading charts and download them as CSV.