- SafetyCulture nutzen
- Analysen
- Was sind Analysen-Dashboards?
Was sind Analysen-Dashboards?
In diesem Artikel erhalten Sie einen Überblick über das Analysendashboard von SafetyCulture.Was sind Analysen-Dashboards?
Die Funktion Analysen ermöglicht es Ihnen, alle Daten an einem Ort zu sehen, auch wenn dies für Gruppen oder Benutzer, die nicht den vollen Überblick benötigen, manchmal überwältigend sein kann. Durch die Erstellung individueller Analysen-Dashboardskönnen Sie den Datenfluss in Ihrem Unternehmen so steuern, dass die Beteiligten nur die für sie relevanten Informationen sehen.
Analysen-Dashboards erkunden
Dashboard-Typen
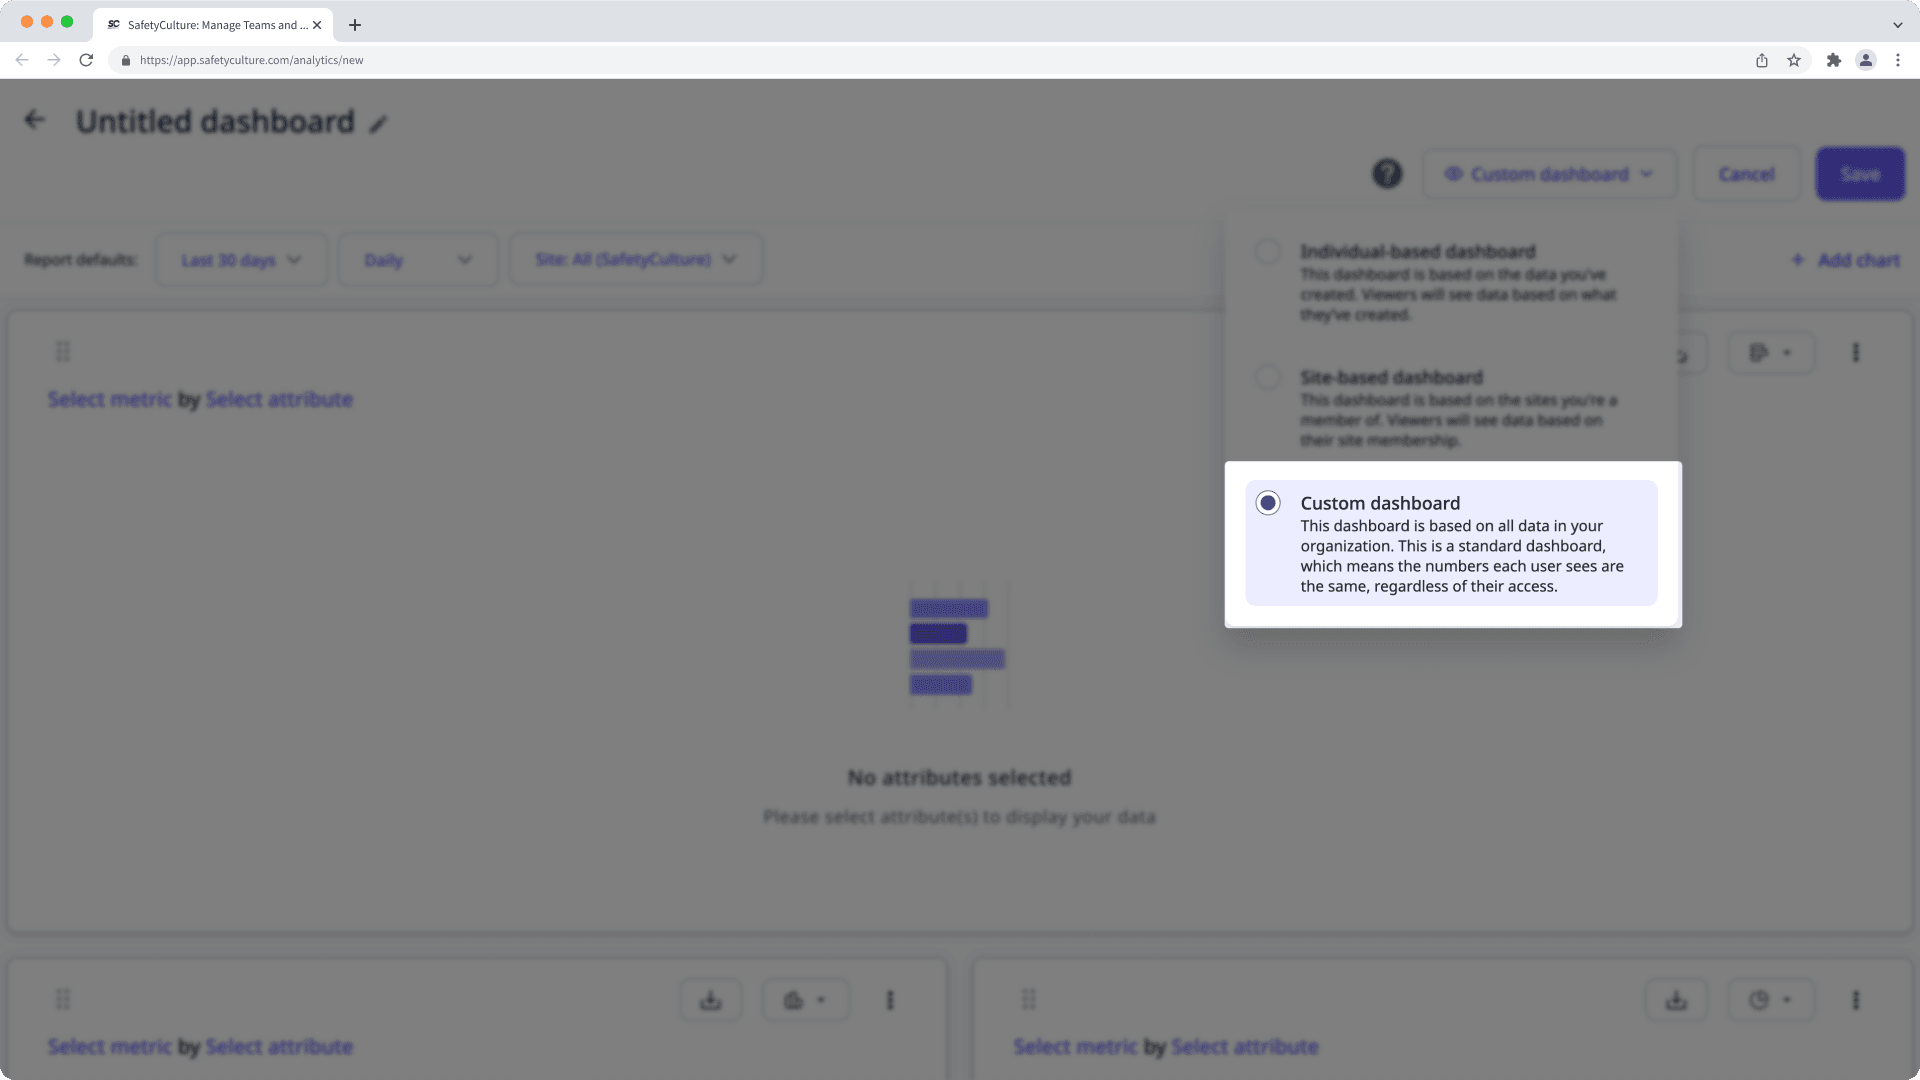
Nutzerdefiniert
Nutzerdefinierte Dashboards sind statisch, d. h. die Daten stammen aus dem gesamten Unternehmen, und was jeder Nutzer auf der Dashboard-Ebene sieht, ist gleich. Wenn ein Nutzer jedoch bestimmte Daten aufschlüsseln möchte, hängt es von seiner Zugriffsebene ab, was er sehen kann.

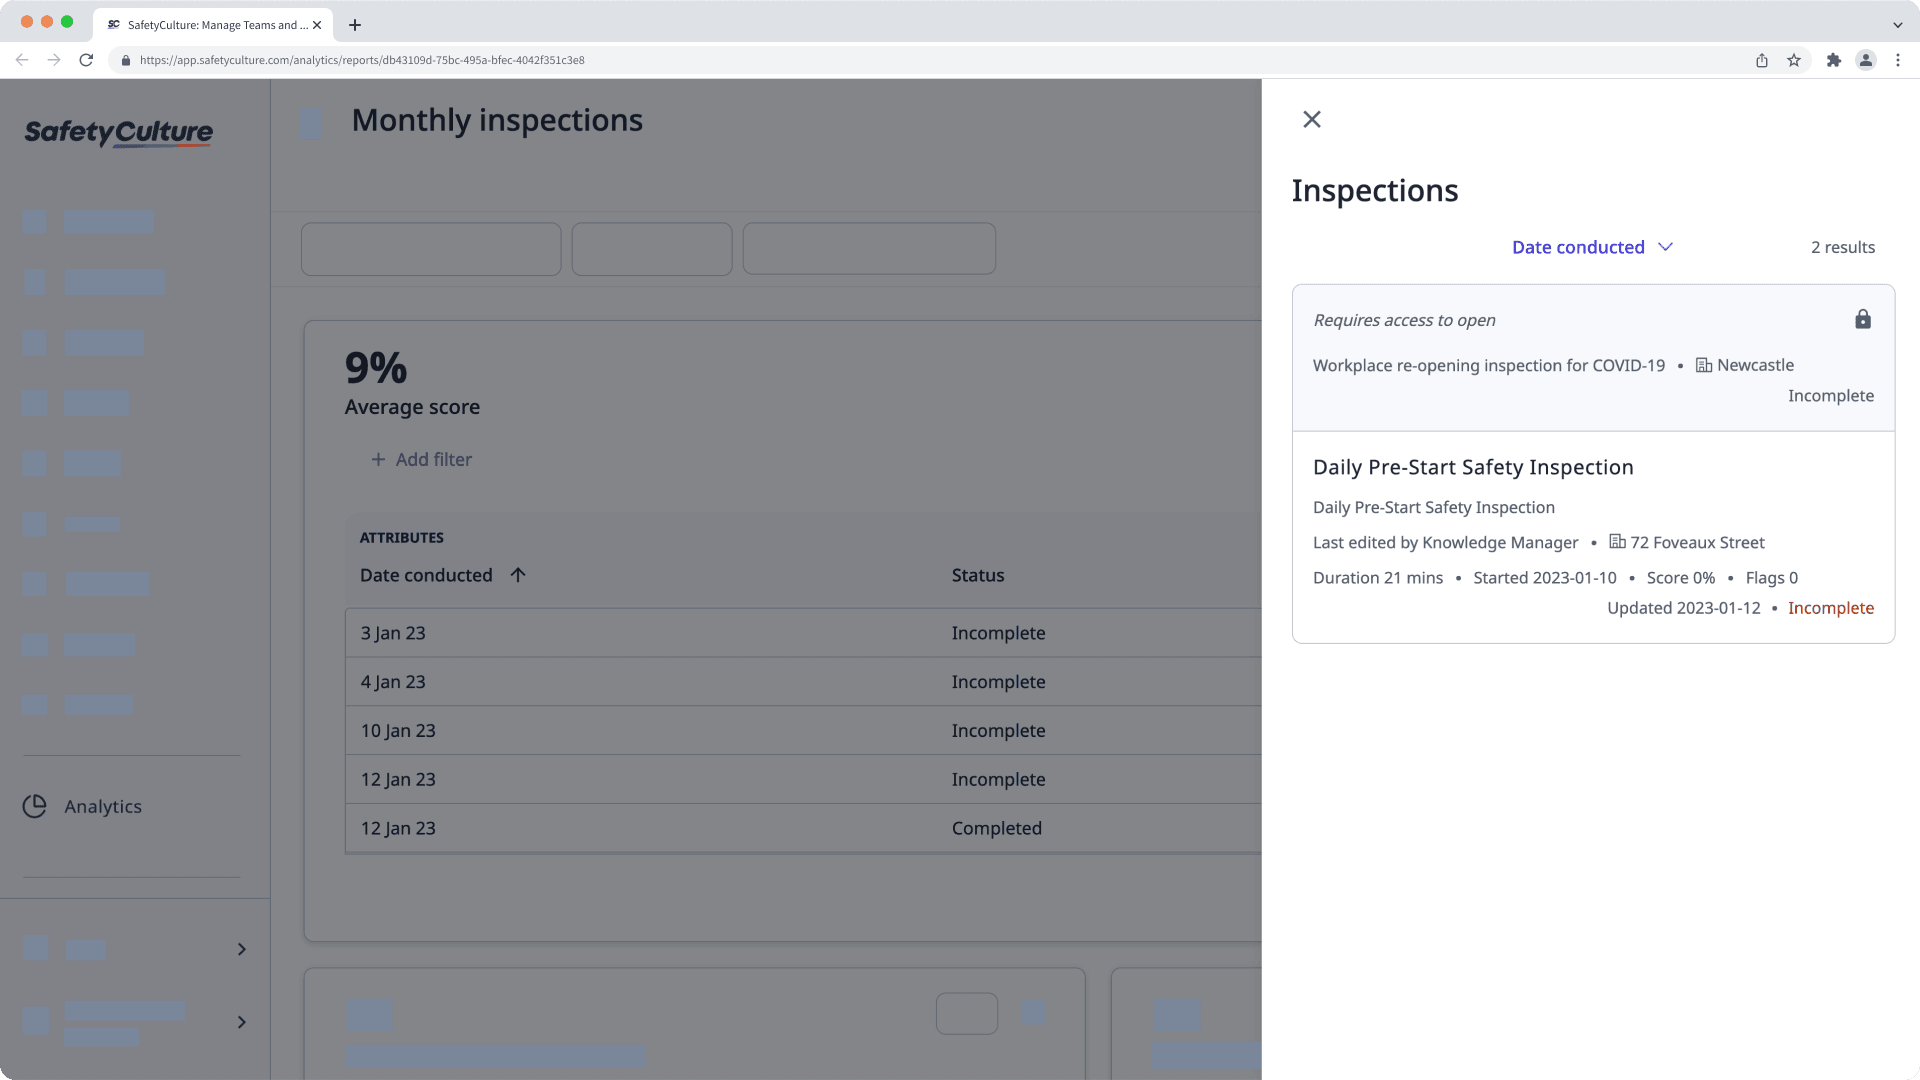
Wenn John beispielsweise ein nutzerdefiniertes Dashboard erstellt, sieht er beim Hinzufügen von Diagrammen und Anwenden von Filtern die Daten der gesamten Organisation. Wenn er das Dashboard mit Jane teilt, sieht Jane denselben Datensatz. Wenn John oder Jane jedoch auf bestimmte Daten zugreifen, können sie nur die Details der Daten sehen, auf die sie Zugriff haben.

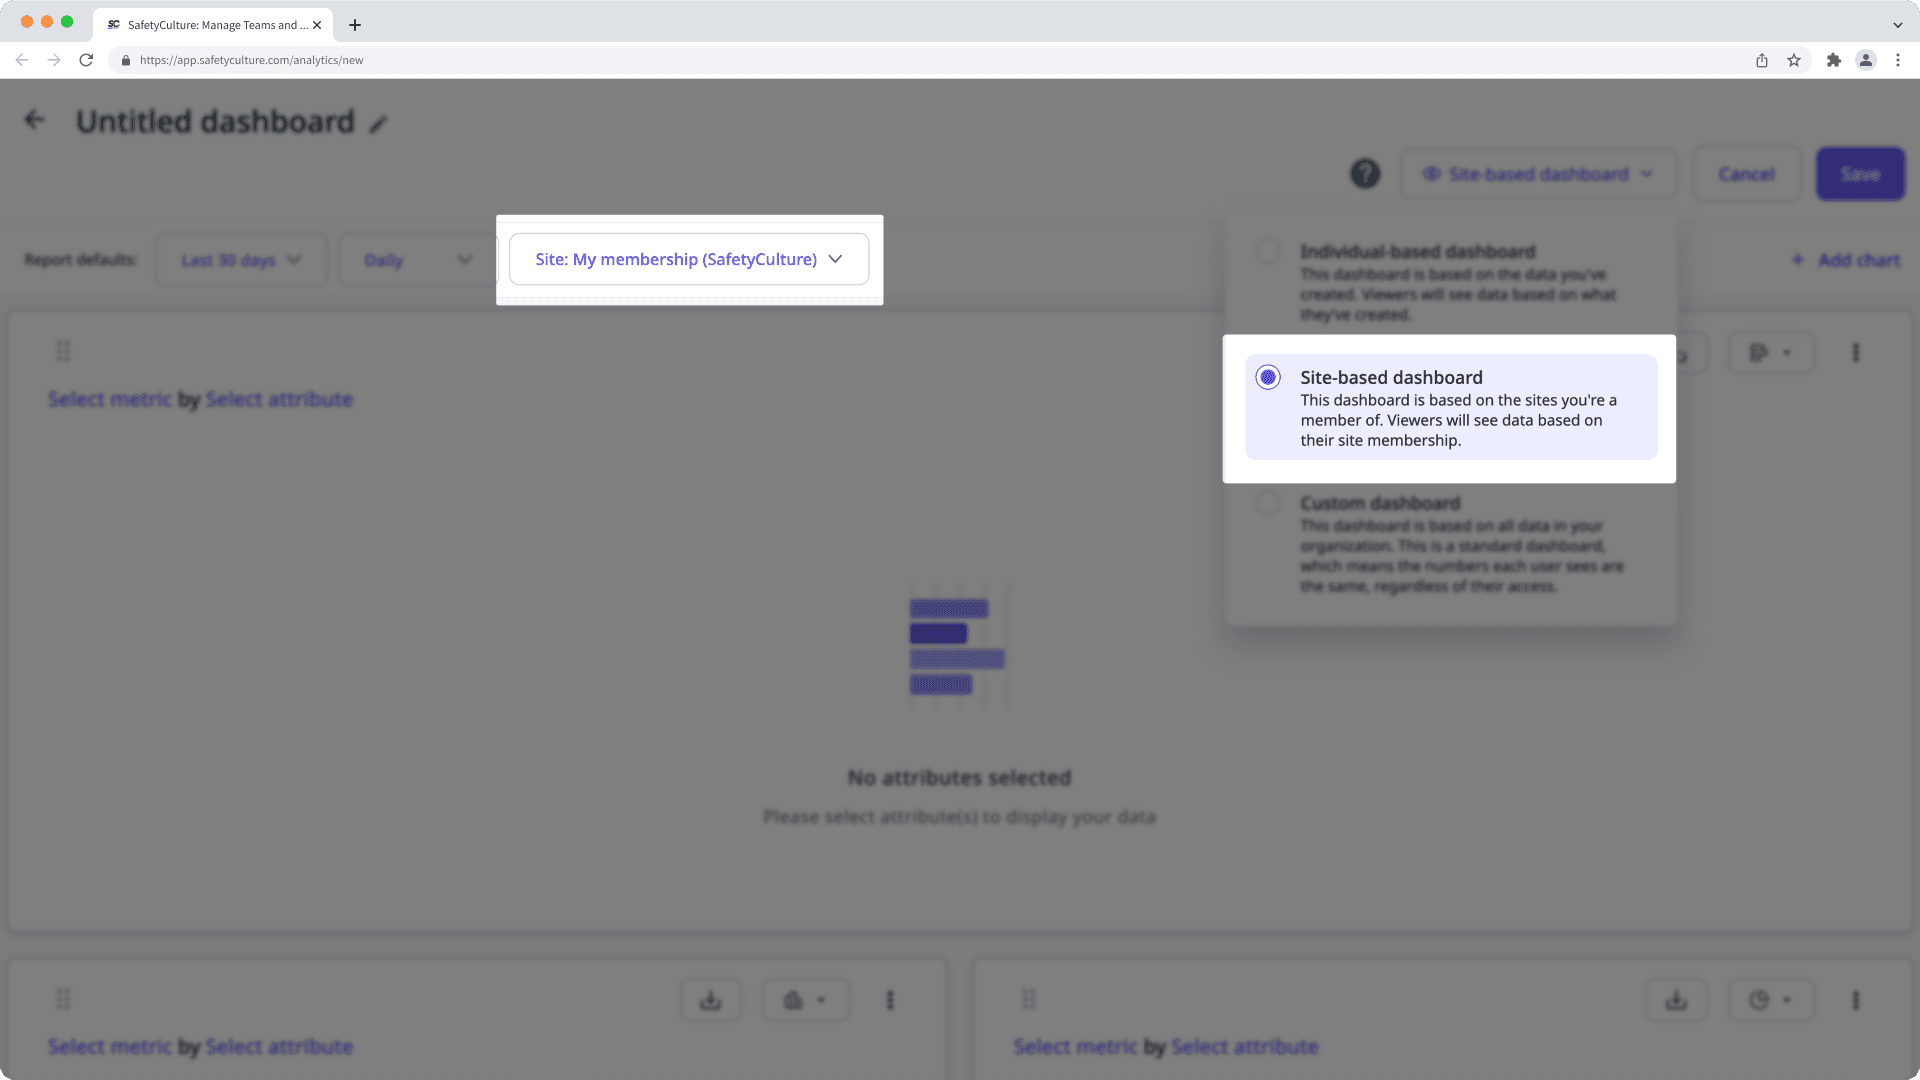
Standortbasiert
Standortbasierte Dashboards sind dynamisch, d. h. jeder Nutzer sieht andere Daten, da sie auf den Daten der Standorte basieren, bei denen jeder Nutzer Mitglied ist.

Wenn John beispielsweise ein standortbasiertes Dashboard erstellt, wird der "Standortmitgliedschaft"-Filter aktiviert und er sieht nur Inspektionen, Aktionen usw, die mit den Standorten verbunden sind, bei denen er ein Mitglied ist. Wenn er das Dashboard mit Jane teilt, kann Jane einen anderen Datensatz sehen, der auf den Inspektionen, Aktionen usw. basiert, die mit den Standorten verbunden sind, von denen sie ein Mitglied ist.
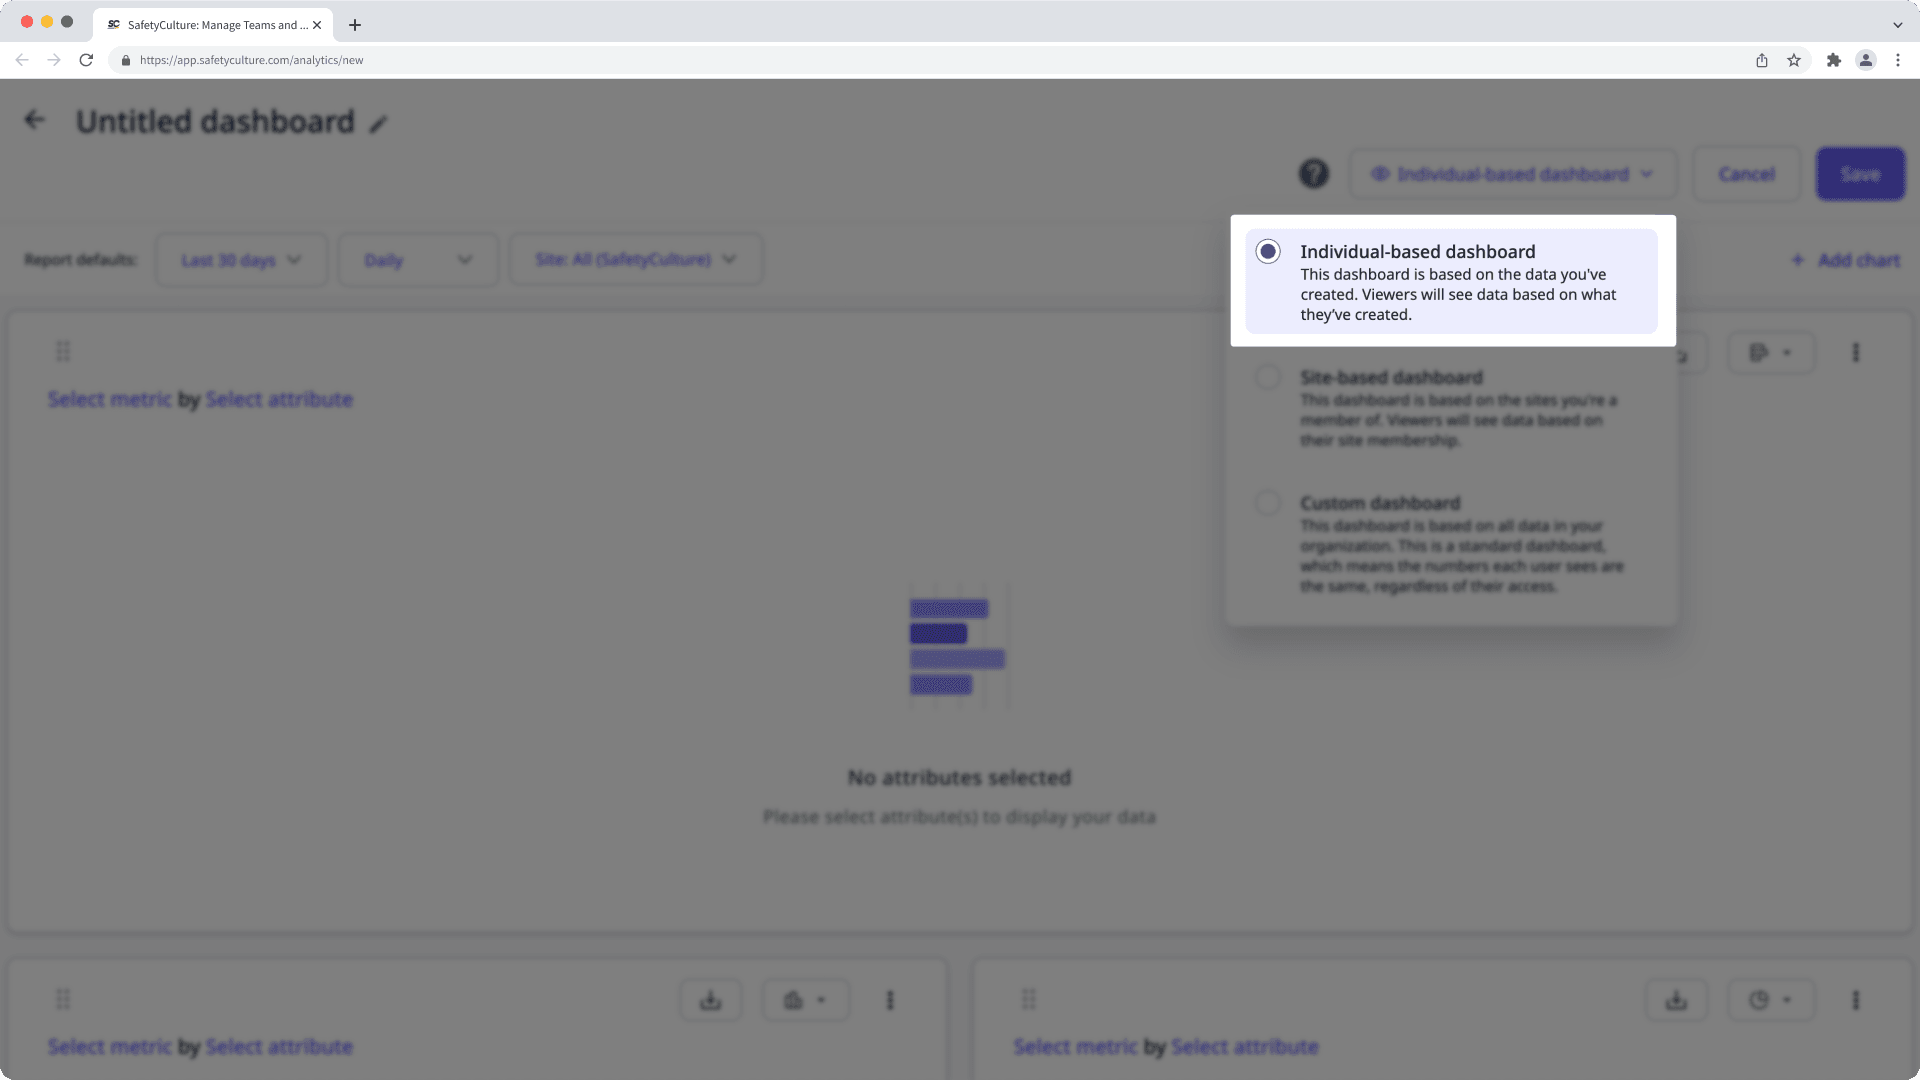
Personenbasiert
Individualisierte Dashboards sind dynamisch, d.h. jeder Nutzer sieht andere Daten, da sie auf den selber erstellten Daten basieren.

Wenn zum Beispiel John ein individuelles Dashboard erstellt, sieht er nur die Inspektionen, Aktionen usw., die er selbst erstellt hat. Wenn er das Dashboard mit Jane teilt, sieht Jane andere Daten, die auf den von ihr erstellten Inspektionen, Aktionen usw. basieren.
Je nach Typ des Dashboards , das Sie erstellen möchten, benötigen Sie die entsprechende Berechtigung:
Benutzerdefiniertes Dashboard: "Analysen: Verwalten" Berechtigung
Standortbezogenes Dashboard: "Analysen: Dashboard erstellen (standortbasiert)" Berechtigung
Individuelles Dashboard: "Analysen: Dashboard erstellen (personengebunden)" Berechtigung
Mehrere Diagramme
Durch das Hinzufügen mehrerer Diagramme zu Ihrem Analytics-Dashboard kann Ihr Team auf einfache Weise Einblicke aus verschiedenen Datenquellen erhalten, Trends erkennen und Metriken in einem integrierten Dashboard vergleichen.
Dashboard-Filter
Filtern Sie Ihr Analytics-Dashboard , um sich auf die wichtigsten Daten für Ihr Unternehmen zu konzentrieren. Legen Sie einen benutzerdefinierten Datumsbereich fest, wählen Sie relevante Websites aus, und wählen Sie bestimmte Gruppen, um Ihre Daten zu filtern und Trends zu visualisieren.
Dashboards teilen
Nachdem Sie Ihr Analytics-Dashboard angepasst haben, können Sie es unter für bestimmte Gruppen freigeben oder allen Mitarbeitern Ihres Unternehmens zugänglich machen. Auf diese Weise können Sie den Zugriff auf der Grundlage von Rollen oder spezifischen Anforderungen steuern und sicherstellen, dass relevante Daten nur für die entsprechenden Teams verfügbar sind.
Dashboard-Anpassbarkeit
Da Diagramme manchmal zu viel Platz auf dem Bildschirm beanspruchen, können Sie die Größe Ihrer Analysediagramme einfach anpassen, um Daten schnell anzuzeigen und zu analysieren. Optimieren Sie Ihr Dashboard, indem Sie die Größe der Diagramme und die Sichtbarkeit der Daten anpassen, um Nullwerte anzuzeigen oder die Gesamtzahl der Metriken auszublenden, damit sich Ihr Team auf einen Blick auf die wichtigsten Informationen konzentrieren kann.
War diese Seite hilfreich?
Vielen Dank für Ihre Anmerkungen.