- Using SafetyCulture
- Assets
- Export asset utilization data as CSV
Export asset utilization data as CSV
Learn how to export the daily and total usage data of all your assets as CSV via the web app.This feature is part of an add-on package for individual assets. To explore if it’s the right fit for your team, reach out to your customer success manager or register your interest for asset maintenance.
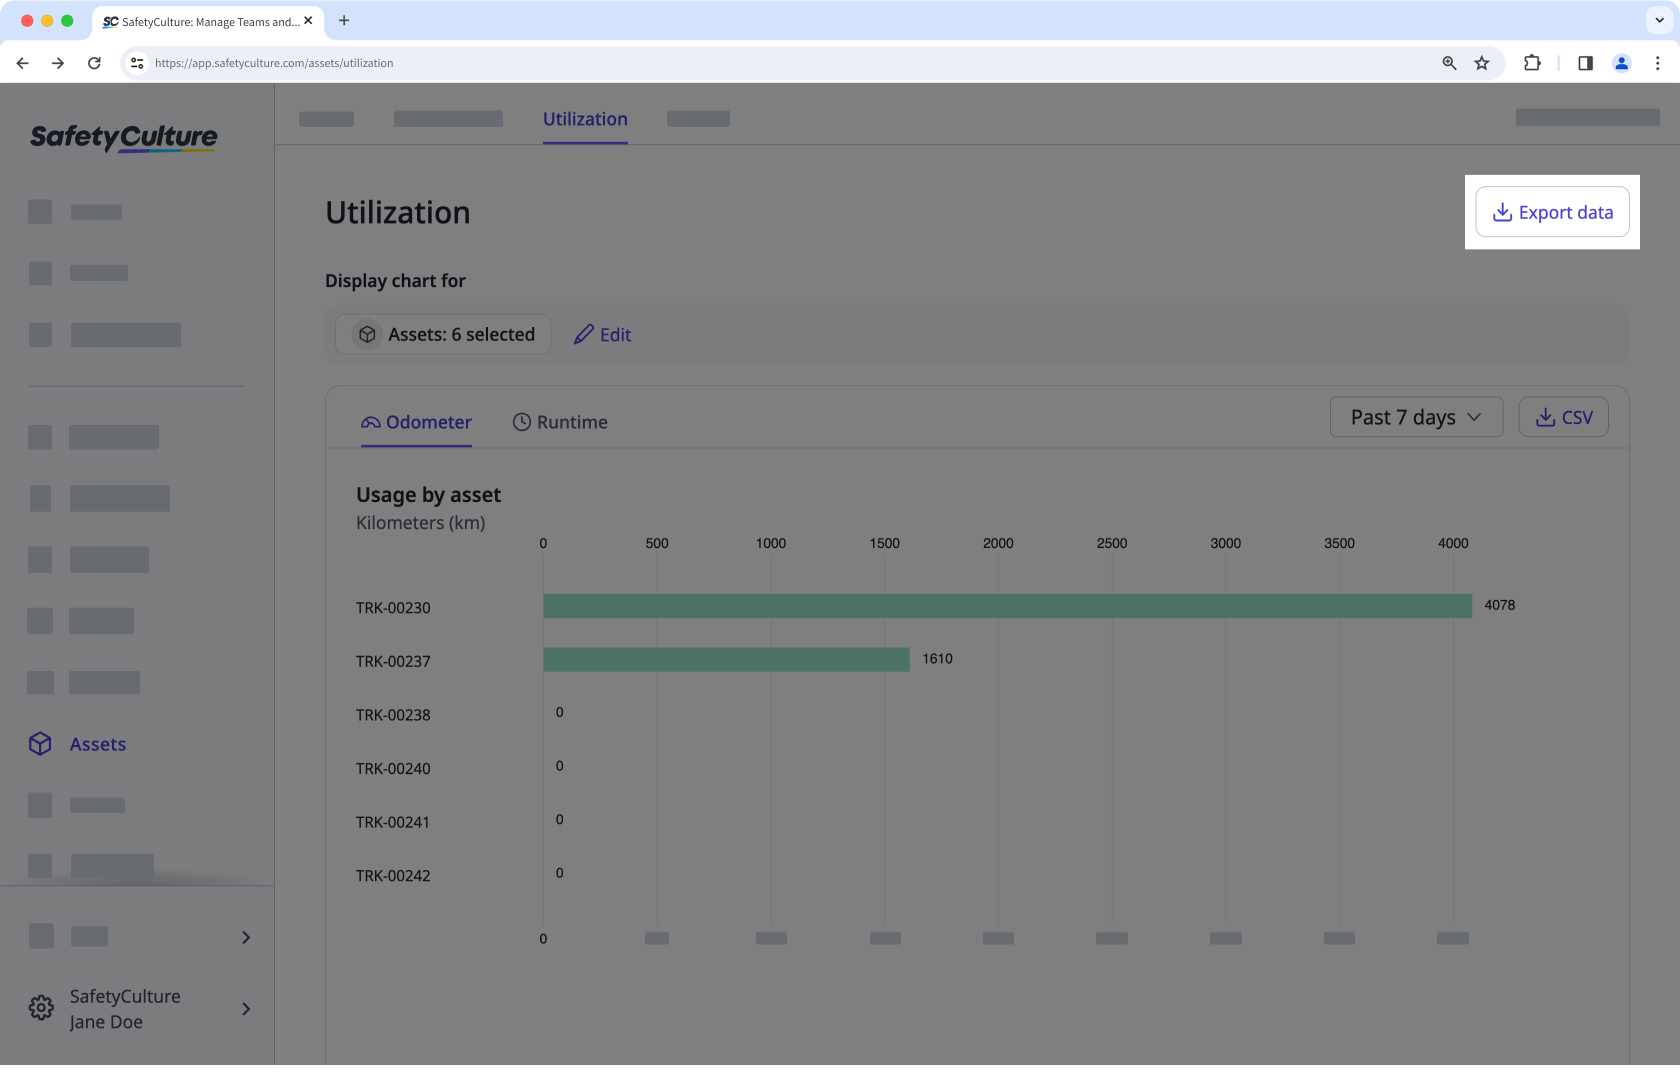
Effectively track the performance of your assets and visualize your data with downloadable utilization charts.
Export asset usage data as CSV
Select
Assets from the menu on the left-hand side.
Select Utilization from the tab at the top of the page.
Click
Export data on the upper-right corner.
In the pop-up window, select the following information:
Preferred period
Reading type
Click
CSV.
CSV column headers
Column header | Description |
---|---|
Type | The type of an asset. |
Unique ID | The unique identifier of an asset. |
Site | The site of an asset. |
Dates | Each day of the period you selected will have a separate column to show the daily usage data of an asset. You can choose to capture asset usage with asset readings via inspections or telematics. |
Odometer total | The total usage data of an asset based on the distance covered either in kilometers or miles. |
Runtime total | The total usage data of an asset based on the time it was used either in minutes or hours. |
Frequently asked questions
This usually happens because of the regional settings in your spreadsheet program. To fix it, set the delimiter to a comma so the values are correctly separated into columns. You can follow the Microsoft Excel guide or the Google Sheets guide to adjust your settings.
The utilization chart calculates daily usage by comparing each reading to the one before it. If a new reading is lower than the previous one, the system sees this as a drop in usage, resulting in a negative value.
Example
The following Usage per day chart is filtered to Odometer (kilometers). Daily usage is positive until Apr 19. This means the cumulative reading saved that day is lower than the last recorded reading before it (Apr 6 in this chart).
The total usage on the upper-right of the chart is the sum of all daily usage values in the selected date range. It shows –3,413 km and indicates a lower new reading.
Why it happens
If there are negative readings, it usually means there was an incorrect entry, reset, or rollback in the source data. Common scenarios include:
Someone entered the day’s usage instead of the full cumulative reading (for example, Tuesday is 5,750 km and Wednesday was recorded as 1,000 instead of 6,750).
An older inspection was submitted after a newer one, putting the entries out of chronological order.
The meter was reset or replaced, so the next value started lower than the previous reading.
The inspection was saved to the wrong asset.
The template is not set up correctly and the number response question was not linked to the correct reading.
How to fix it
1. Find the date
Search for the asset's profile and select any of the readings available. Check the usage per day chart and verify when the negative reading was captured.
Open the asset profile and select a reading to view the usage per day chart. Locate the negative value and take note of the date (for example, 12 Aug).
If your team reports a negative usage value and you can’t find it in the asset’s Usage per day bar chart, you may be viewing a different reading type or data source. Switch to a different reading to see the correct chart.
2. Verify and fix the evalues
Was the newer value lower than the previous reading? | Replace the answer with the full cumulative reading for that day. Keep the same unit as the template and keep entries in chronological order. Result: Usage recalculates as a positive difference and the negative bar disappears. |
Was an older inspection submitted after a newer one? | Correct the inspection date/time or re-enter the reading in chronological order for that asset so readings progress forward. Result: The chart uses the right pair of consecutive readings and usage displays correctly. |
Is the number question linked correctly in the template? | Click the asset question and link the reading to the number question. Test with a new inspection. Result: New inspections store readings to the asset and charts update correctly going forward. |
Was the inspection conducted for the correct asset? | Submit a corrected inspection for the right asset with the proper cumulative reading. Result: Each asset’s chart reflects only its own readings and anomalies are removed. |
Was the meter reset or replaced? | Add a short note explaining the reset, then treat the first reading after the reset as the new baseline and continue with cumulative values from there. Result: Future usage calculates correctly from the new baseline and negative spikes are resolved. |
3. Confirm the fix
Return to the utilization chart and refresh the page. The negative values should not appear and usage reflects the difference between the corrected consecutive readings.
Keep readings reliable
Use these practices to help your team capture consistent and accurate readings.
1. Standardize question names
Create a separate number response question for each linked reading and clearly explain what value is required. You can phrase them as statements, questions, or instructions. Some examples include:
Statement style: Odometer (km) at end of shift
Question style: What is the odometer reading (km) at end of shift?
Instruction: Enter the full odometer value shown on the odometer display at the end of your shift. Do not enter the day’s distance.
2. Use a shared template
Ask your team to use one template for this workflow so everyone sees the same questions in the same order.
3. Place questions in a template section
Put the reading questions in a section such as End of shift so operators record them alongside other closeout checks.
4. Run a light weekly review
Regularly review utilization for high-use assets and scan for dips or outliers.
5. Plan for meter changes
When a meter is replaced or reset, treat the first new value as the baseline going forward.
Was this page helpful?
Thank you for letting us know.